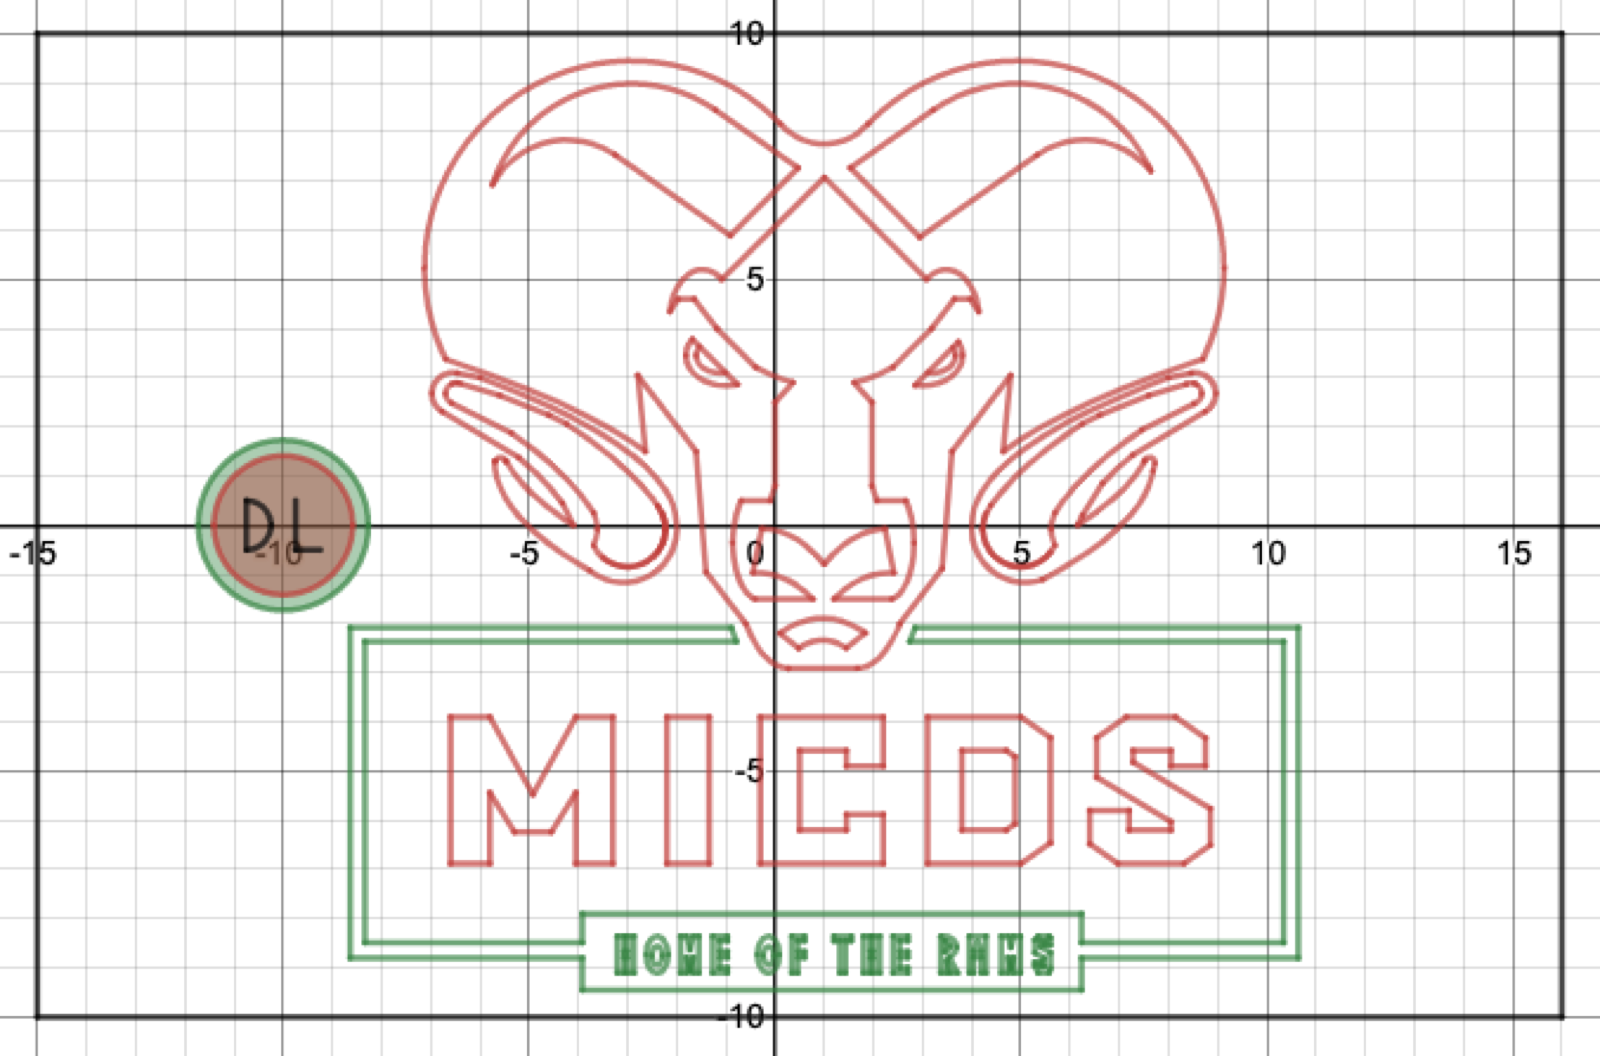
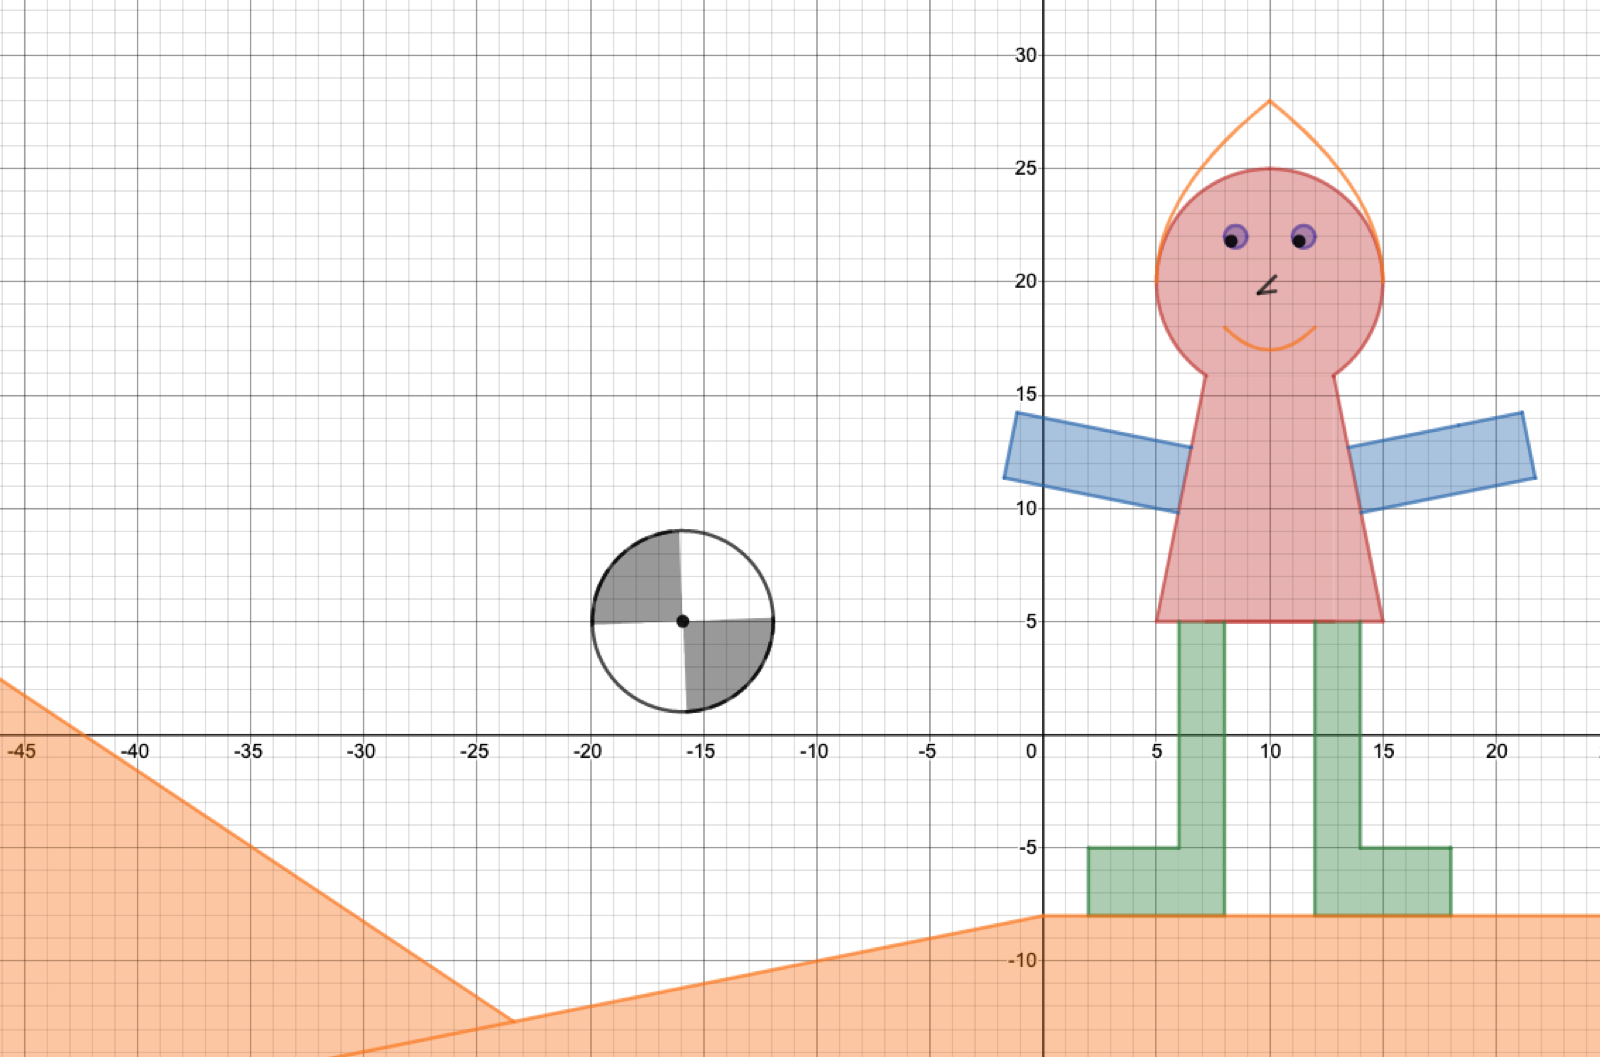
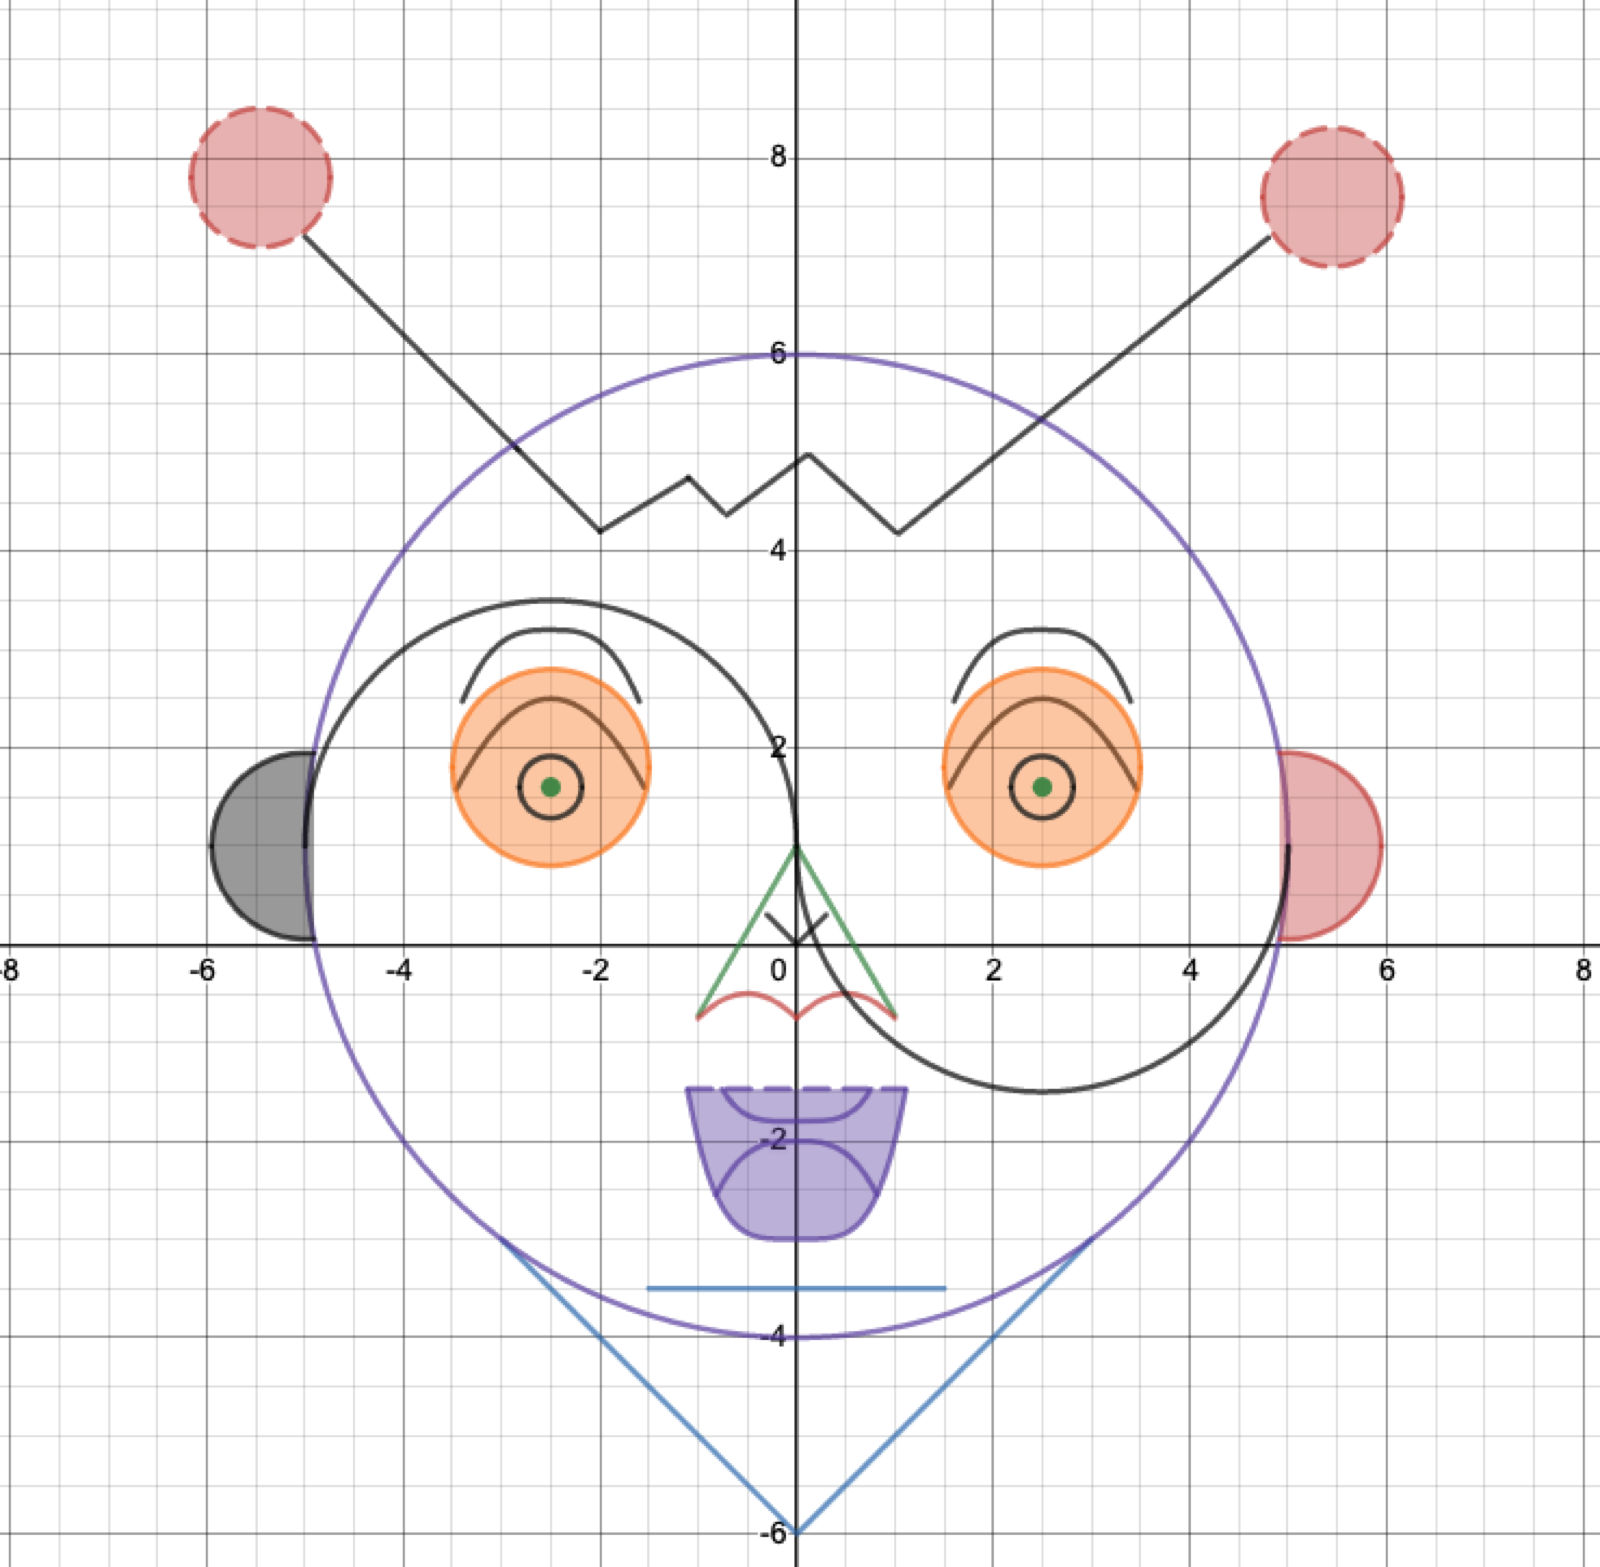
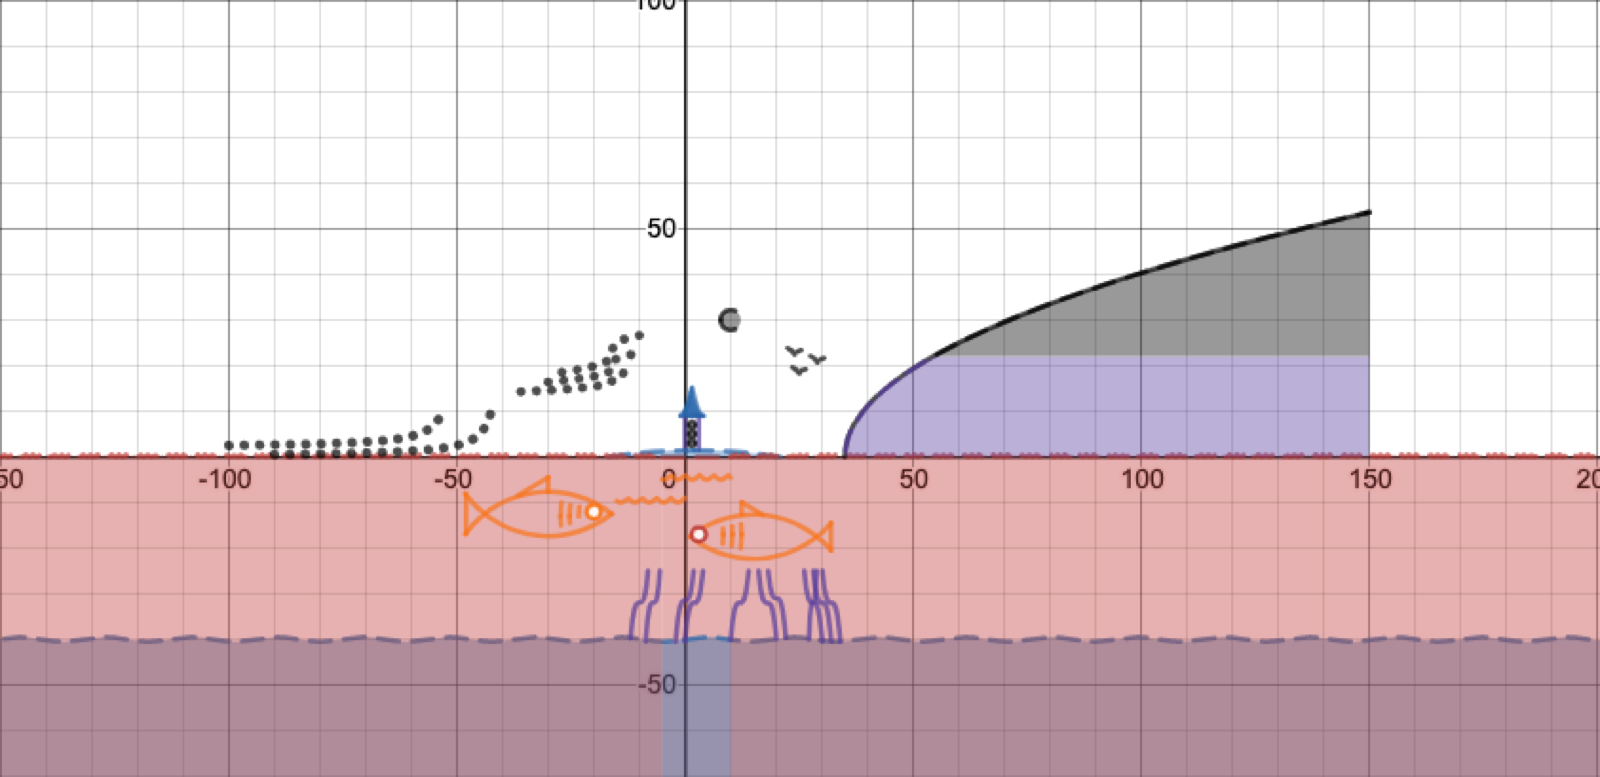
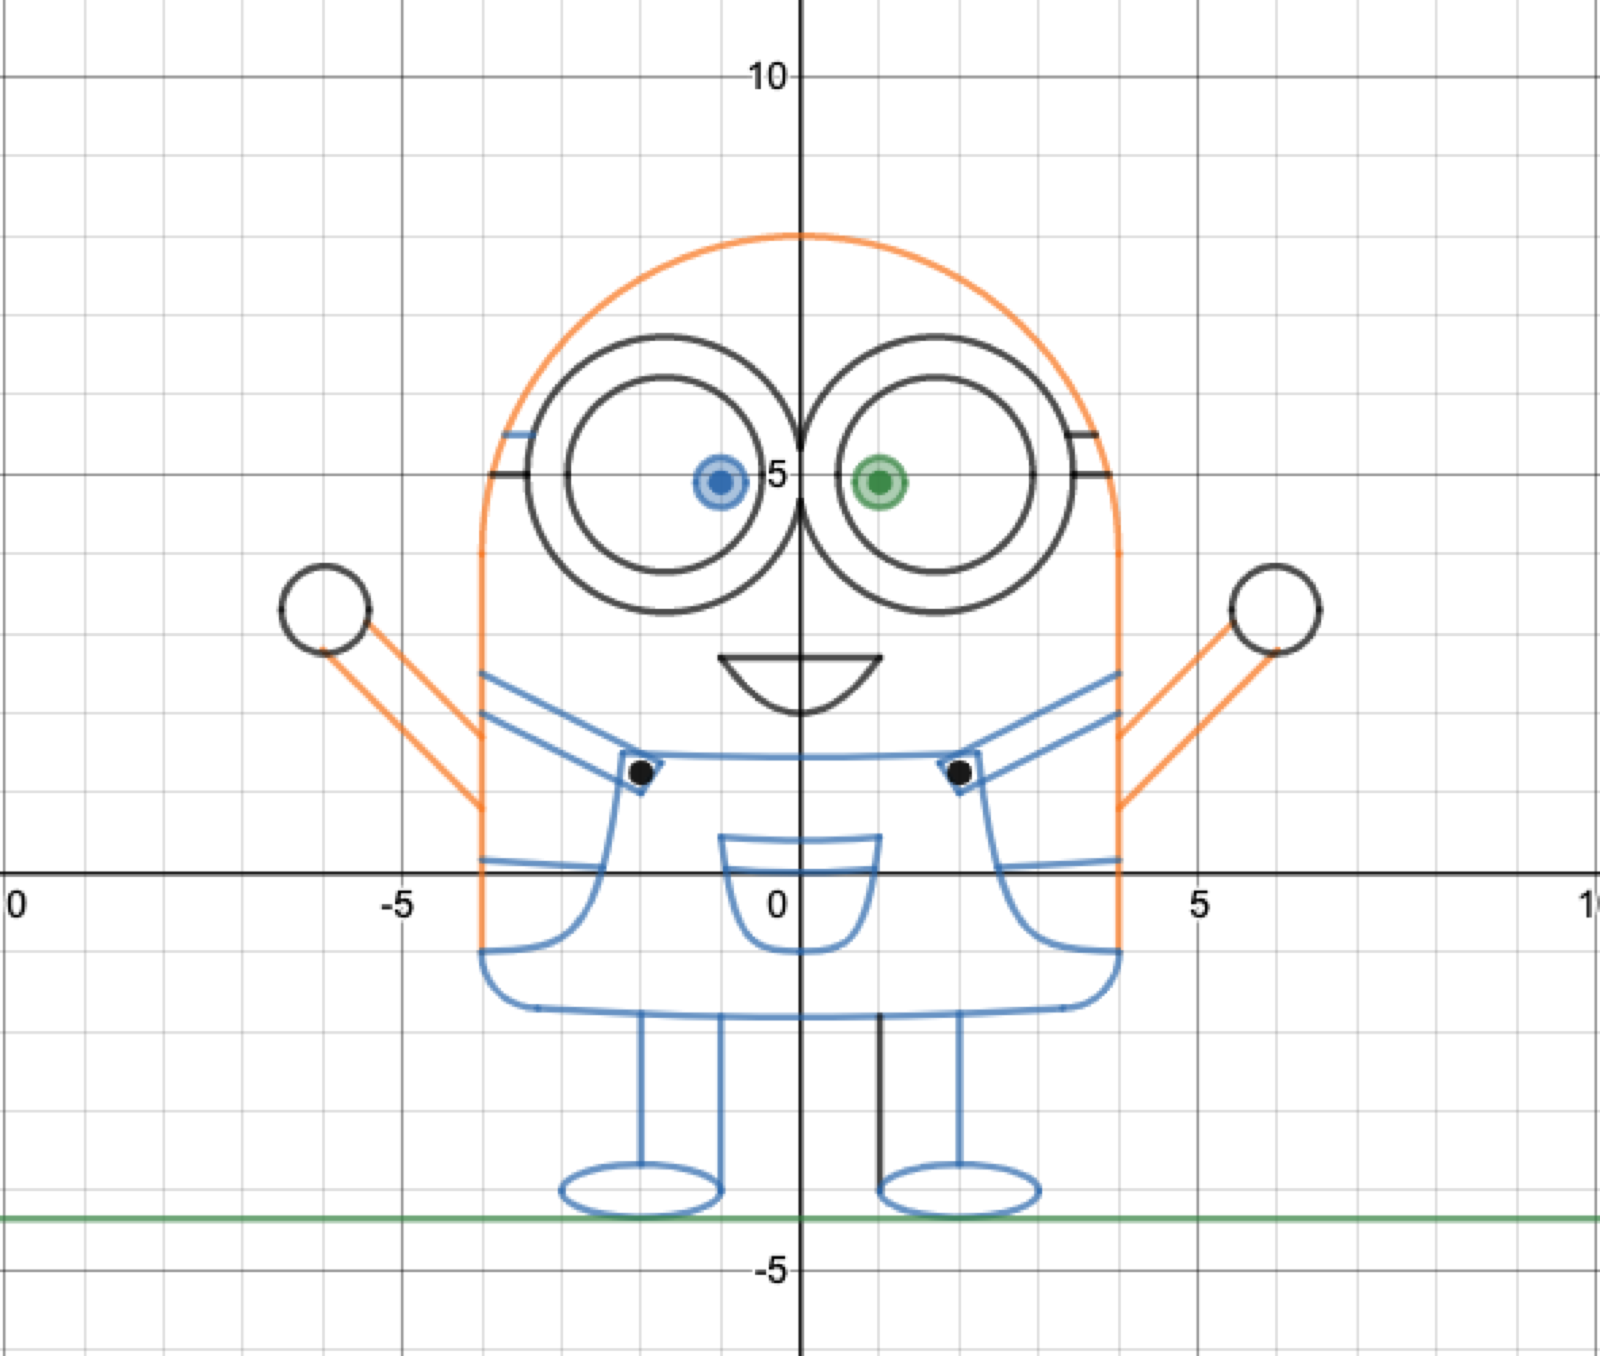
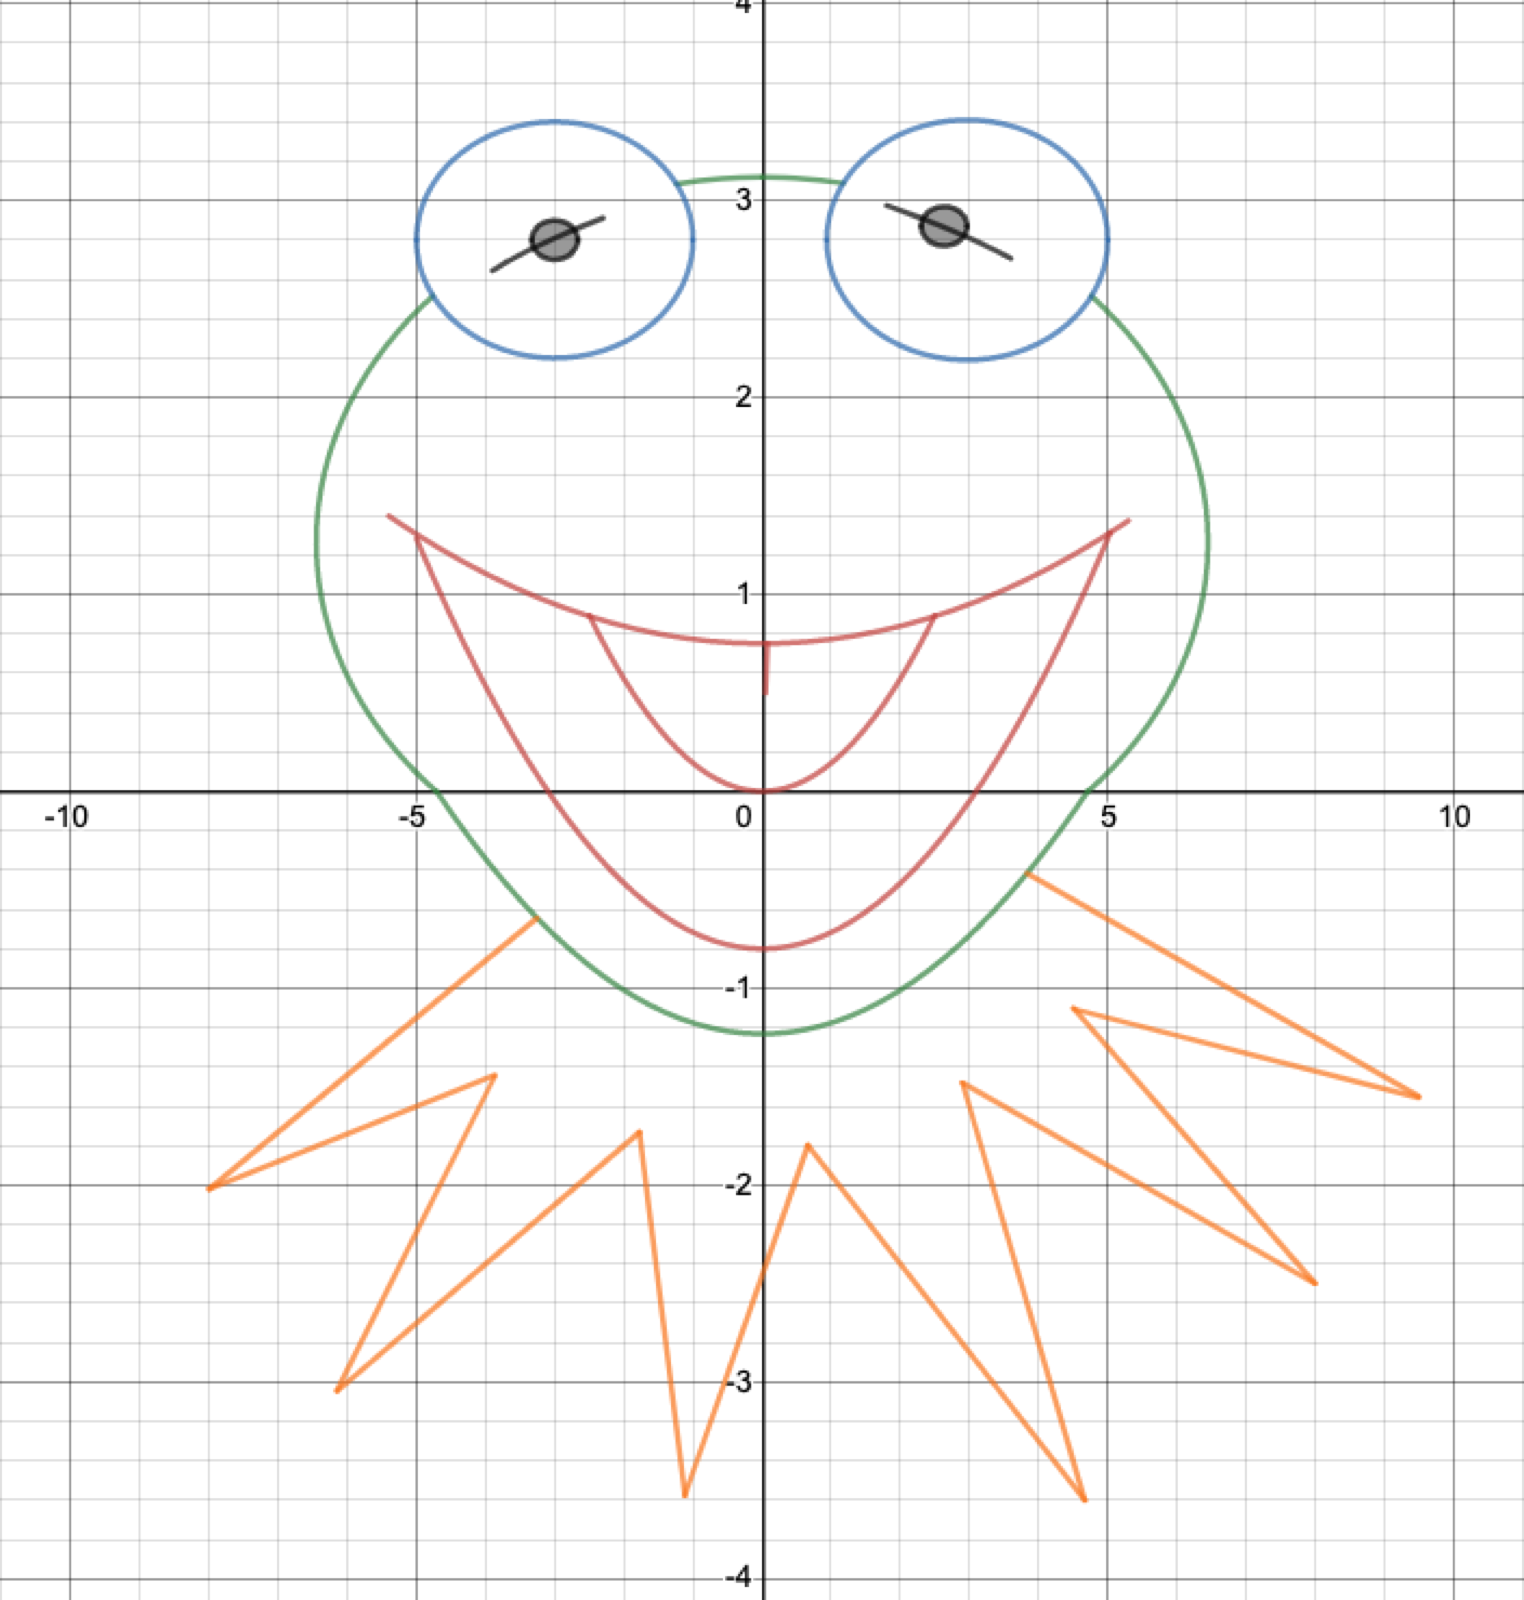
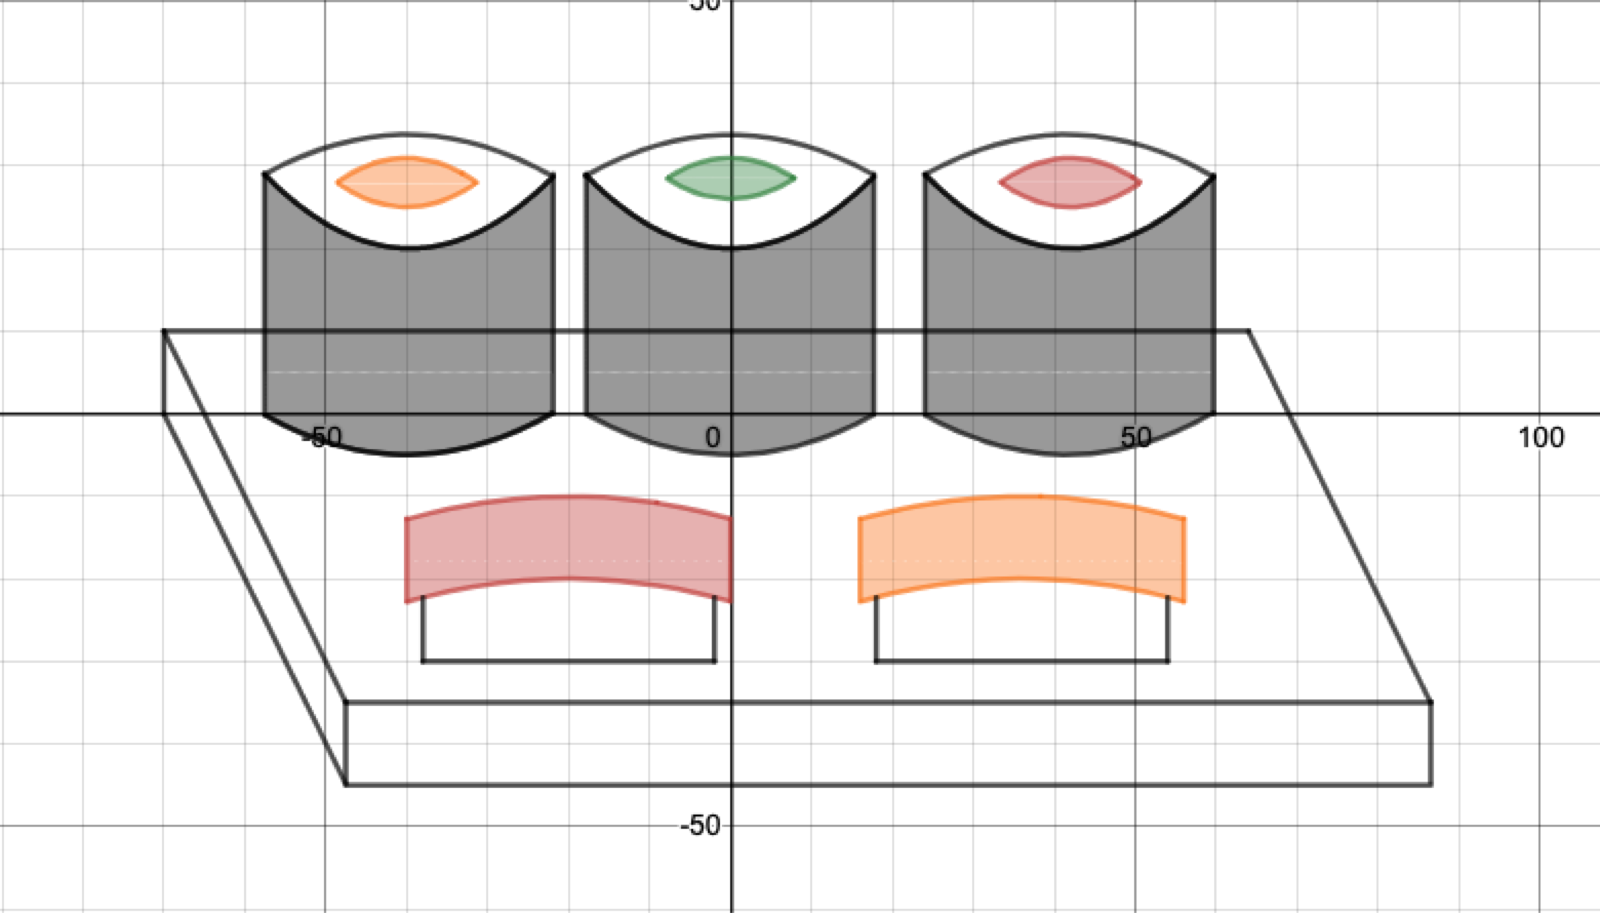
Calling all math lovers! Check out this great project that 8th and 9th grade students in Math Teachers Lauren Fletcher and Dr. Jody’s Marberry’s Integrated Math I Accelerated classes recently completed: a Function Translation project using Desmos, an online graphing calculator. These “mathmagicians” were tasked with demonstrating their knowledge of parent functions and translations (horizontal and vertical shifts, reflections across the x and/or y-axes, etc.) to make graphs. Graphed lines were then given domain and range restrictions to create student-designed specific images. Their creativity can be seen here:
Students reflected on the project when asked about what they found to be the most challenging part:
- Making sure it met all of the requirements.
- Using Desmos, and getting the functions to look how I wanted them to.
- Finding a way to include all the function transformations while making a picture that looked realistic or cool.
- Coming up with an idea and then graphing it.
- Being creative when there were so many requirements and restrictions. It was hard to keep track of what I did and what I had to add.
- Thinking of an idea of what to put in.
What did they learn about functions, translations, and/or graphs that they didn’t know before?
- I learned a lot about absolute value graphs and reflecting them over the x and y axes.
- I didn’t know how to properly use Desmos and how to actually graph functions using Desmos.
- I learned about reciprocals and how they are graphed.
- I learned how to do a lot of things in Desmos that I didn’t know before. I also learned that graphing can be a cool way to create art and is sometimes easier than using paper.
- I learned that functions can be translated very easily.
- I knew all of the translations, but I didn’t know how to graph them. I now realize how hard it is to graph translations.
- I learned what sin, cosine, and tan look like on a graph.
What great projects, math students!
