
I am hardly an avid user of the social media platform formerly known as Twitter, but I can still remember two tweets from several years ago that made me laugh out loud. One was a post by the critically acclaimed writer (and former St. Louis resident) Patricia Lockwood to the highbrow literary quarterly The Paris Review: “So is Paris any good or not” (Wait for it…) The other, which I have referenced once before at MICDS, quoted an urban developer named Vince Graham: “I am, at the federal level, a libertarian; at the state level, a Republican; at the local level, a Democrat; with my family and friends, a socialist; and with my dog, a Marxist.” Graham’s quip popped into my mind upon reading The American Renaissance Is Already at Hand by David Brooks in last Thursday’s New York Times, and again on Monday night as I watched the perennially hapless New York Jets—even with future Hall of Famer Aaron Rodgers already out for the season—manage to upset the Buffalo Bills in overtime.
Brooks’ opinion piece, a love letter to one’s inner libertarian, contrasts fiscal policy in the United States and China, contending that the latter’s “centralized authoritarian control is incompatible with a wide-open, innovative, free-flowing modern economy,” whereas “there’s a lot of resilience and dynamism in America’s brand of broadly free market capitalism.” Point taken, inner libertarian, but I would submit by way of counterpoint the latest Green Bay Packers’ financial report, which is nothing if not a love letter to one’s inner socialist. The publicly-owned Packers (power to the people!), of whom fiscal transparency is required by law, recorded $610 million in revenue last year, a whopping 61% of which ($374.4 million) was attributable to “central revenue distribution from the NFL.” If professional football adhered strictly to principles of free market capitalism, I am relatively confident that Green Bay, the 161st-largest metropolitan statistical area in the United States, would not be the home of the second-winningest franchise in NFL history. I am equally confident that in such a world the New York Jets, whose local market includes 19.6 million potential fans, would not have been the underdogs in Monday night’s contest against the Buffalo Bills, whose market is less than six percent that size. I do not know whether Vince Graham would describe himself as a socialist with family and friends and professional sports teams, but I would not be surprised if he does.
Conversations about equitable access to higher education in our country are on the rise thanks in large measure to Opportunity Insights, a non-partisan, not-for-profit social empowerment organization that has undertaken—among other illuminating endeavors—“big data” research on college and university enrollments. In July they published Diversifying Society’s Leaders? The Determinants and Causal Effects of Admission to Highly Selective Private Colleges, which of their numerous projects may be the most relevant to our work at MICDS as a college preparatory school. Upon reading the report, which sorts its findings by family household income, I found myself seeking information further segmented by student race and ethnicity, so I decided to consider Opportunity Insights’ data alongside related statistics from the U.S. Census Current Population Survey (CPS, also here), the Congressional Budget Office (CBO), the Federal Reserve Board Survey of Consumer Finances (SCF), and the National Center for Education Statistics Integrated Postsecondary Education Data System (IPEDS).
From this combined dataset, I learned that at the flagship public institutions that Opportunity Insights studied—UCLA, Michigan, UNC, Ohio State, and UVA, for example—38% of students come from the top 10% of family households, with incomes of $212,000 or higher. (The median United States household income is approximately $70,000.) At “Ivy-Plus” universities (Brown, Columbia, Cornell, Dartmouth, Duke, Harvard, MIT, Princeton, Stanford, U. Chicago, Penn, and Yale), over half of undergraduates—54%—come from the top 10% of households, and the median household income of students at these institutions is likely in the neighborhood of $255,000.
The combined data also reveal that there are as many undergraduates in the Ivy-Plus cohort from the top 1% of households (with incomes that exceed $570,000) as there are from the bottom 60% (with incomes that top out at $90,000). Because White households comprise 88% of the top 1% of income earners, and because 75% and 69% of Black and Hispanic households, respectively, are in the bottom 60% of all households, disproportionate representation by household income begets disproportionate representation by ethnicity and race. The estimated median household income of Ivy-Plus undergraduates is $310,000 for White students, $250,000 for Asian-American students, $160,000 for Hispanic students, and $130,000 for Black students.
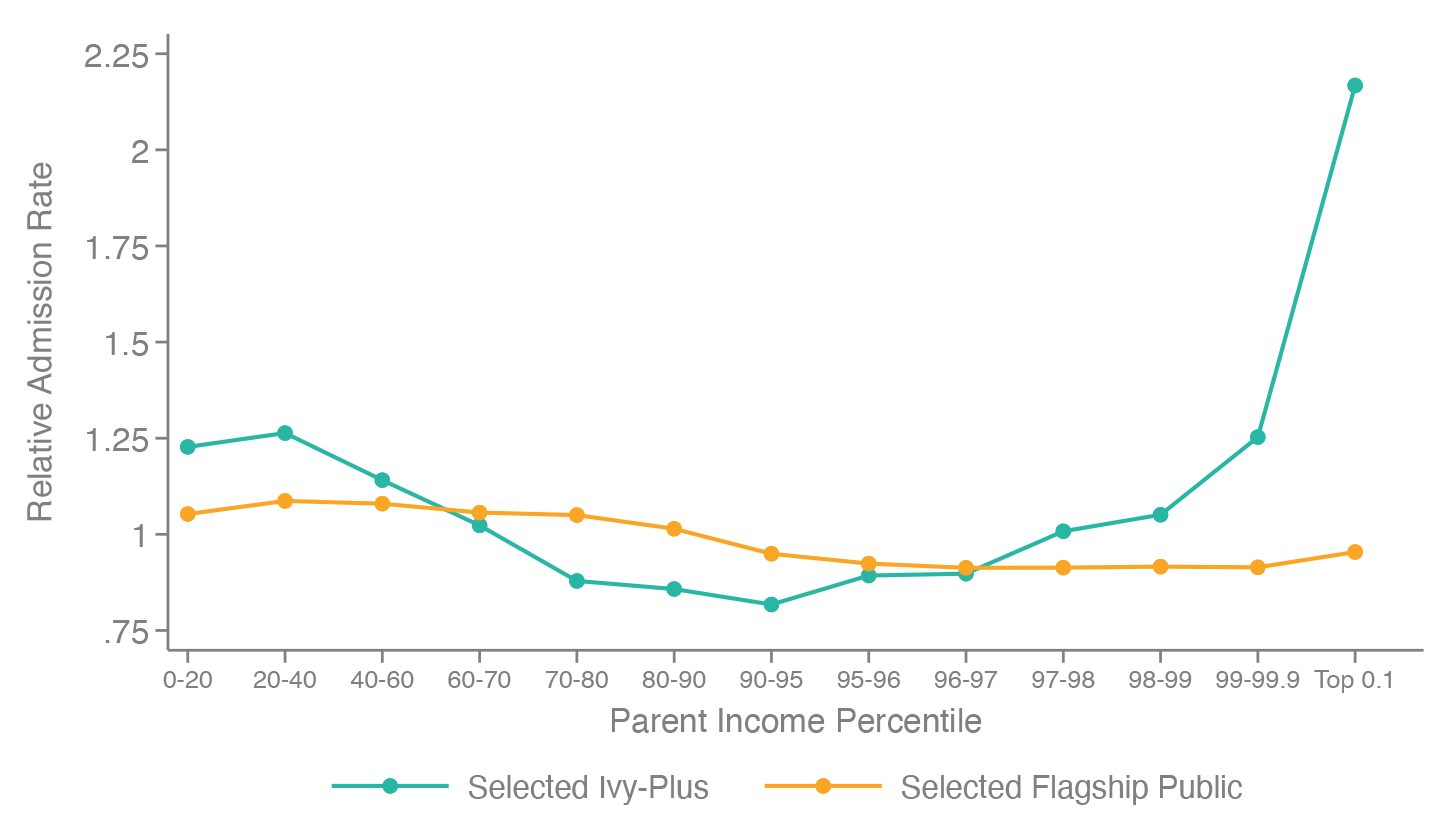
At last year’s MICDS Admissions Open House, I was pleased to boast that our seniors are admitted to highly selective institutions—colleges and universities with acceptance rates under 25%—at a frequency 1.6 times the overall average. I am proud of how well our seniors perform by this measure, but I was nonetheless disheartened to discover in reviewing the Opportunity Insights research how significantly a student’s admissions advantage at Ivy-Plus schools varies by household income. Even after controlling for ACT and SAT test scores, the study determined that an above-average advantage is enjoyed by applicants with household incomes below $113,000, and an extraordinary advantage is enjoyed by applicants with household incomes in the top 0.1%. These advantages doubtless reflect, respectively, the commitment of elite private institutions to providing opportunities to students with limited financial resources and the simultaneous dependence of these institutions on major donor philanthropy. The unfortunate effect, however, is a reduction in the likelihood of admission for comparably qualified students with household incomes between $113,000 and $351,000. The same disparity is not nearly so pronounced at flagship public universities, as this New York Times infographic tool illustrates.
Together these phenomena work to distort and poison our national discourse about access to elite undergraduate institutions. Because, for example, 42% of Asian-American households fall into the relatively disadvantaged upper middle income brackets, conventional wisdom asserts that students from these households “can’t get in” to such institutions, and yet Asian-American students are considerably overrepresented in selective undergraduate programs, comprising 25% of domestic student enrollment in the Ivy-Plus cohort despite only comprising 6% of United States households. Conventional wisdom also asserts that because of affirmative action admissions policies—recently ruled unconstitutional by the Supreme Court in a case reflective of our fractious national discourse—Black and Hispanic applicants are overrepresented at elite universities, and yet their 28% share of households contributes only 24% of domestic students at Ivy-Plus schools and 21% of those at the public flagship universities in the Opportunity Insights study. Moreover, the average likelihood of acceptance for Black and Hispanic students is essentially equivalent to that of the general applicant population (as is the average likelihood of an Asian-American student, for that matter) notwithstanding affirmative action in admissions.
As for White students, while it is true that undergraduate populations at Ivy-Plus institutions are now “majority minority” (65% of American households are White, whereas only 40% of Ivy-Plus domestic undergraduates are), because about half of their domestic White students are from the top 4% of households, and because high-income applicants have the greatest admissions advantage at Ivy-Plus institutions, White students enjoy the highest average likelihood of acceptance to those institutions—an advantage that belies the supposed reverse discriminatory impacts of (now illegal) affirmative action programs. At public flagship universities, while higher income-earning households are also overrepresented, no racial or ethnic group has such an advantage.

A nation’s Gini coefficient quantifies income inequality in its society. Among free-market nations, the United States has a relatively high Gini coefficient, which is to say relatively high income inequality. We also, to be fair, enjoy a very high national happiness score; and in any event, as the graph above makes plain, happiness scores are only minimally explained by income equality. Even so, it is worth noting that every other country with a higher happiness score than ours also has a lower Gini coefficient. Every happier country, in other words, has less socioeconomic inequality than we do. Because there is no more powerful instrument than education to improve opportunity and reduce inequity, the Opportunity Insights revelations about elite college and university enrollments should give us pause as citizens, if not as patriots.
“American politics is dysfunctional, and our social fabric is in tatters, but somehow our economy is among the strongest in the world,” writes David Brooks in his American Renaissance piece. “Our economic competitors stumble and fall; we stumble, and somehow bounce back.” Maybe we can have it all—economic prosperity and social harmony at once. Maybe we can be guided by our inner libertarian on economic policy and our inner socialist on education policy. If a revenue redistribution program, the scale of which would make many an actual socialist green with envy, has been a key to success for the most profitable sports league in history, perhaps confronting inequities in our educational institutions is in the best interest of our collective future. Sometimes the secret to getting, after all, is giving. What’s good for family and friends is clearly good for professional athletics and is good for schools, too. As for dogs, I will promise not to tell yours that you’re a Marxist if you promise not to tell mine.
Always reason, always compassion, always courage. My best wishes to your families for a joyful weekend.
Jay Rainey
Head of School
This week’s addition to the “Refrains for Rams” playlist: No Easy Way Down by Dusty Springfield, the tenth track on her album Dusty in Memphis (1969), which is included in the book 1001 Albums You Must Hear Before You Die (Apple Music / Spotify)