To kick off the school year in eighth-grade algebra classes, Middle School Math Teacher Dr. Jody Marberry sent her students on a data hunt. Rather than starting with textbooks and abstract formulas, students spent the first week gathering real-time data to acquaint themselves with the three core mathematical relationships they will study all year: linear, exponential, and quadratic functions.
For those who are rusty on their algebraic relationships, here’s an overview:
- Linear functions: This process changes by the exact same amount at every step. On a graph, it forms a perfectly straight line with a constant rate of change.
- Exponential functions: Growth that multiplies rather than adds. It starts slowly, then shoots upward rapidly as the rate of change accelerates, based on what is already there.
- Quadratic functions: A relationship built around a peak or a turning point. It moves up and comes back down (or vice versa), forming a symmetrical U-shaped curve known as a parabola.
To visualize these functions, students participated in several games to break down the concepts.
The Linear Experiment
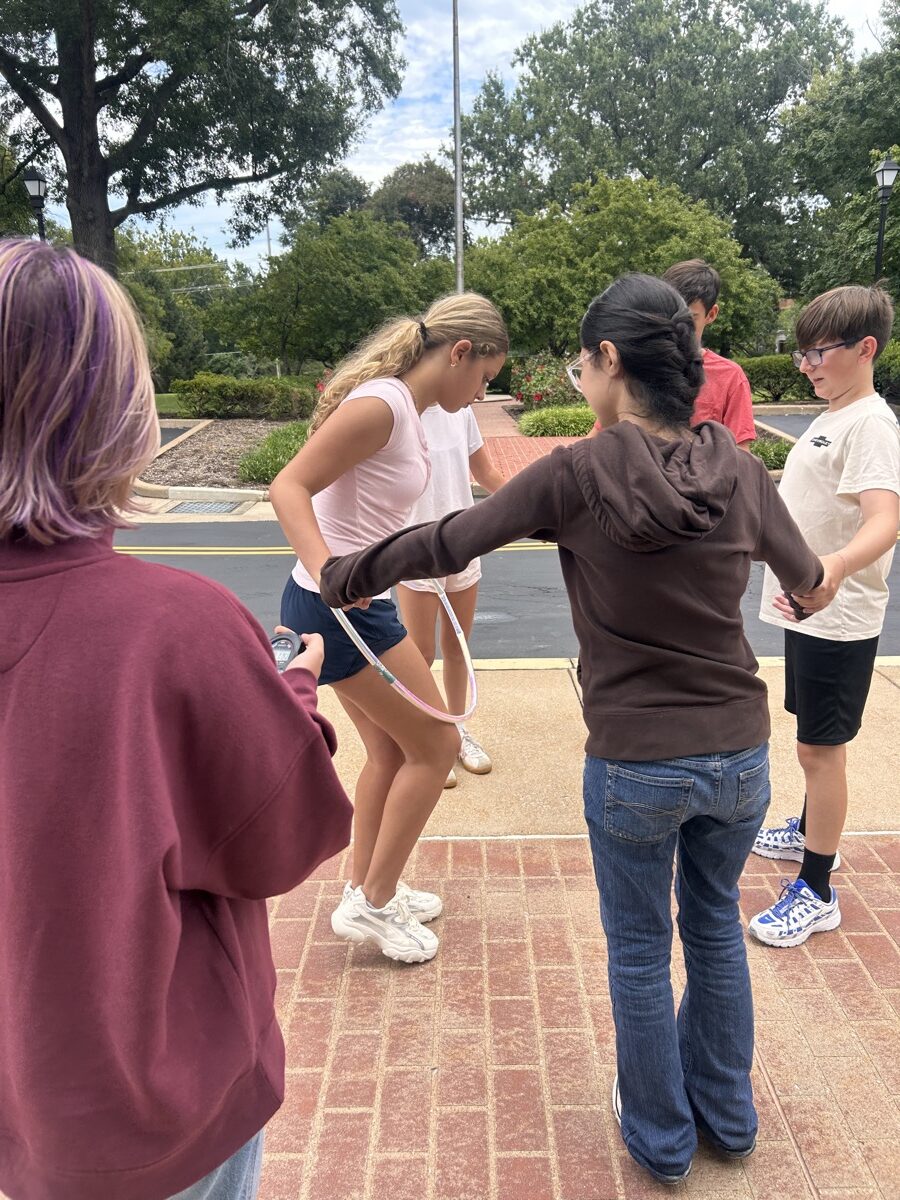
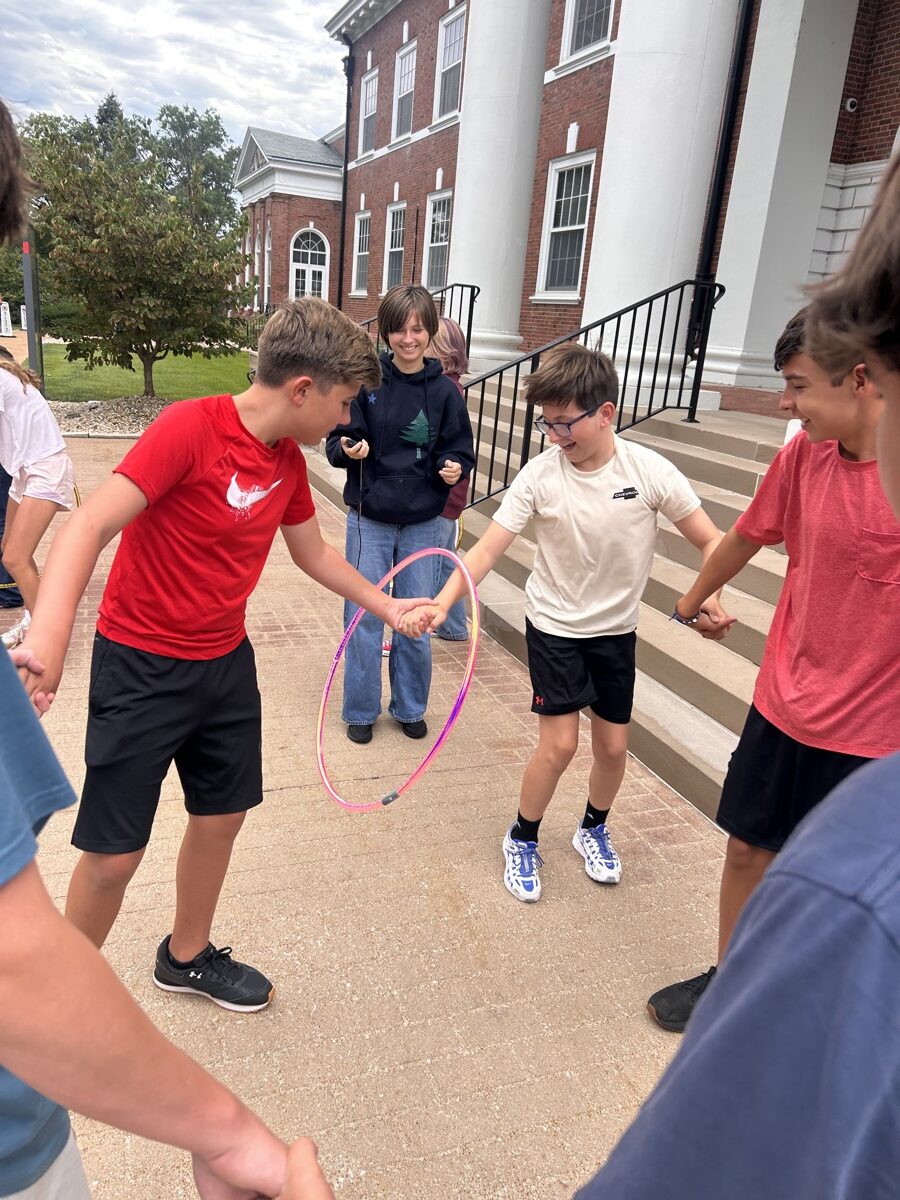
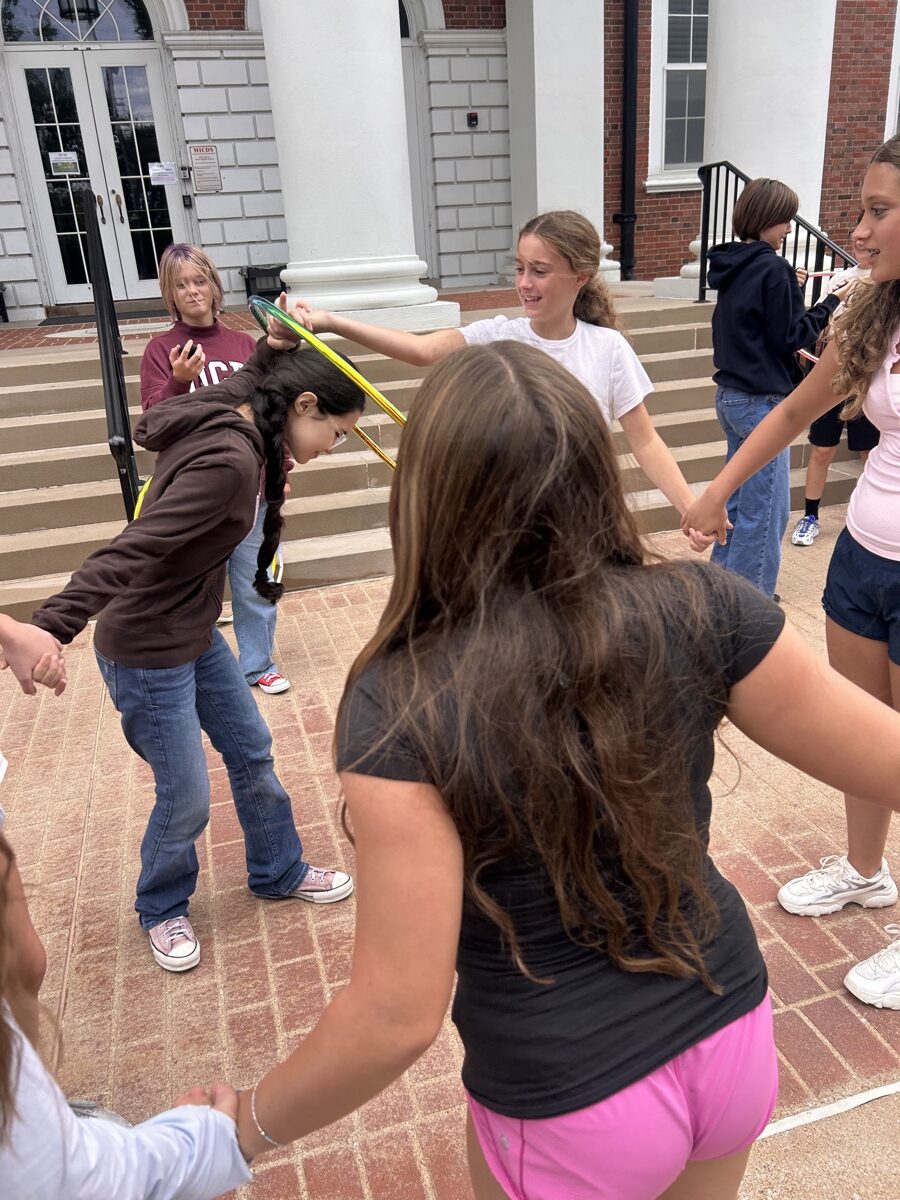
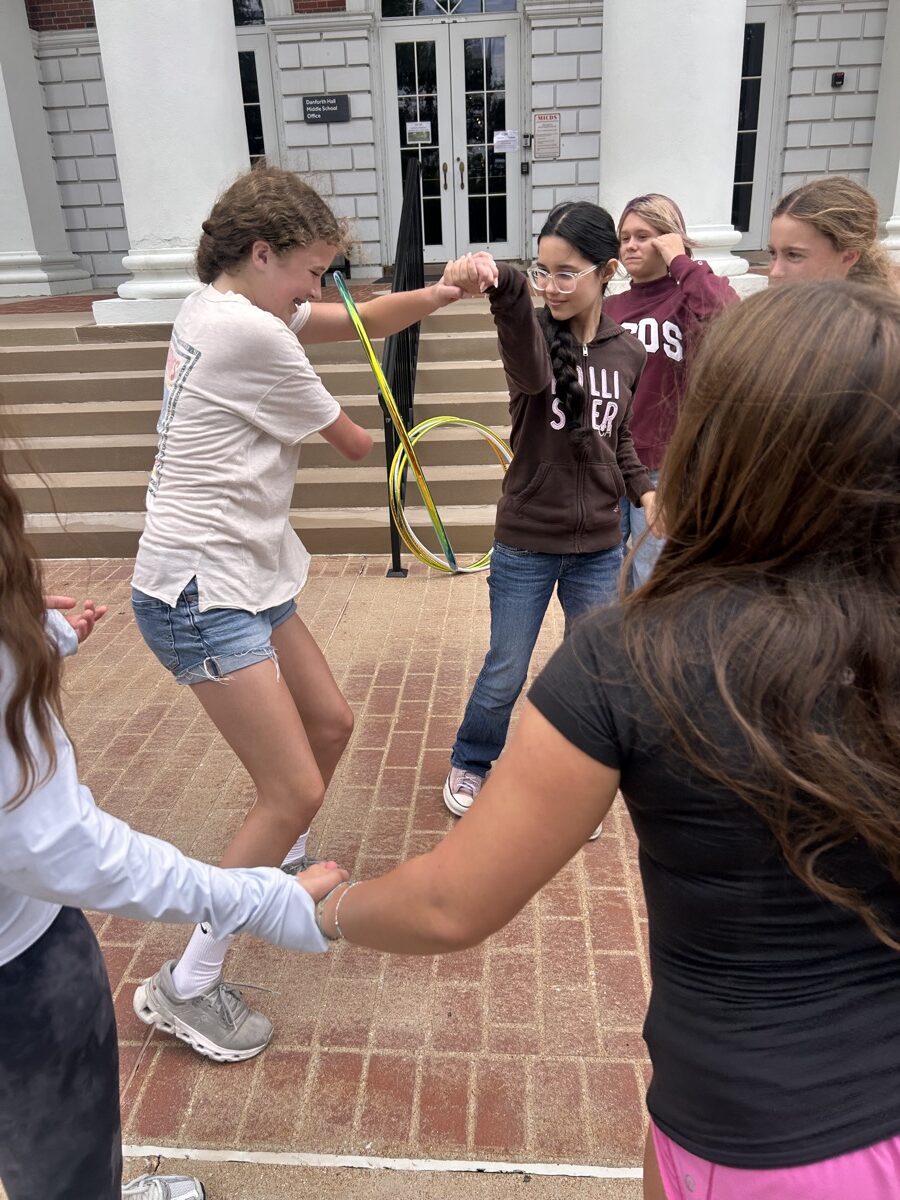
With everyone in a circle and holding hands, a hula hoop was passed around by stepping through it without letting go of each other’s hands. Students timed different-sized groups and determined how adding or removing a person changed the predictability of the overall time. They then used the data to predict how many hours it would take to pass a hoop through their entire city’s population. They repeated this type of data collection with a tricky tongue twister using the number of speakers vs. total time elapsed to further understand linear modeling.

The Exponential Lab
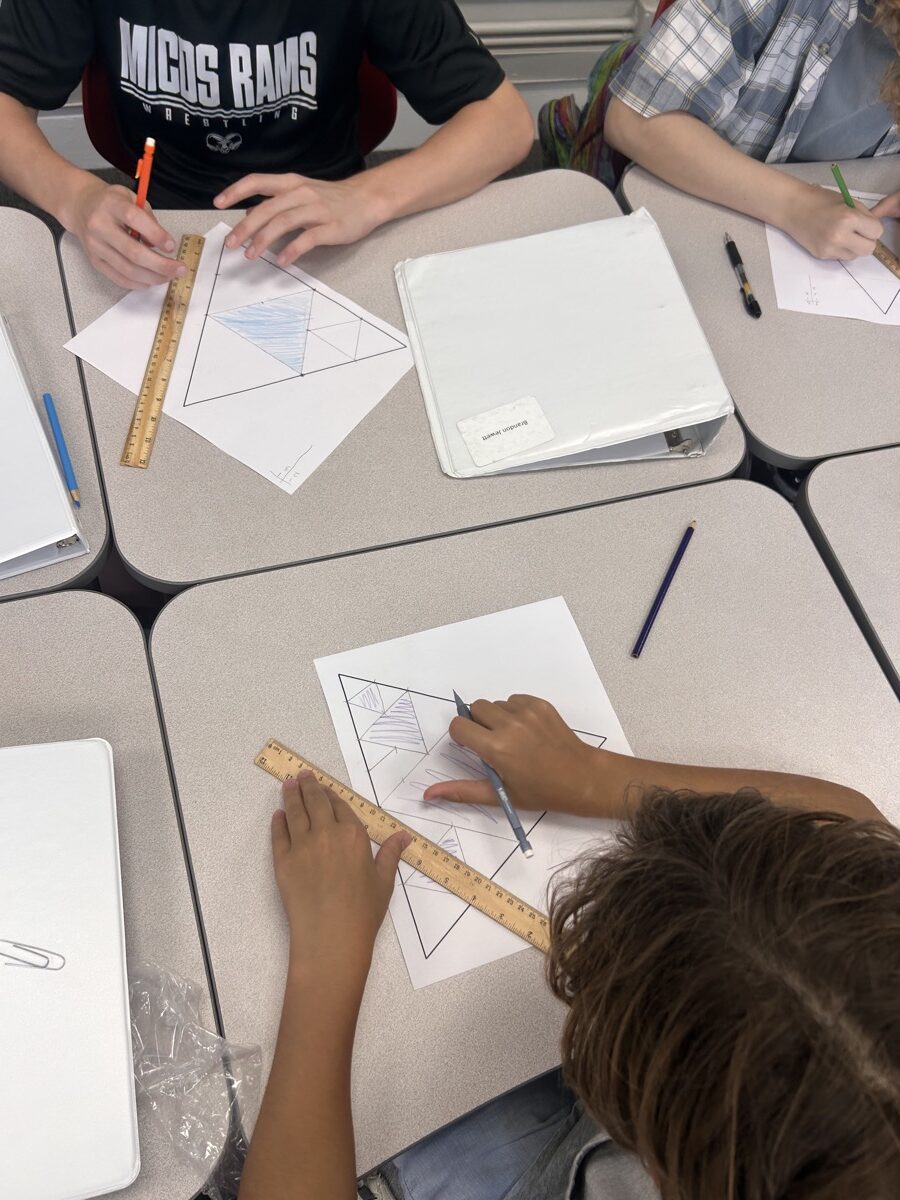
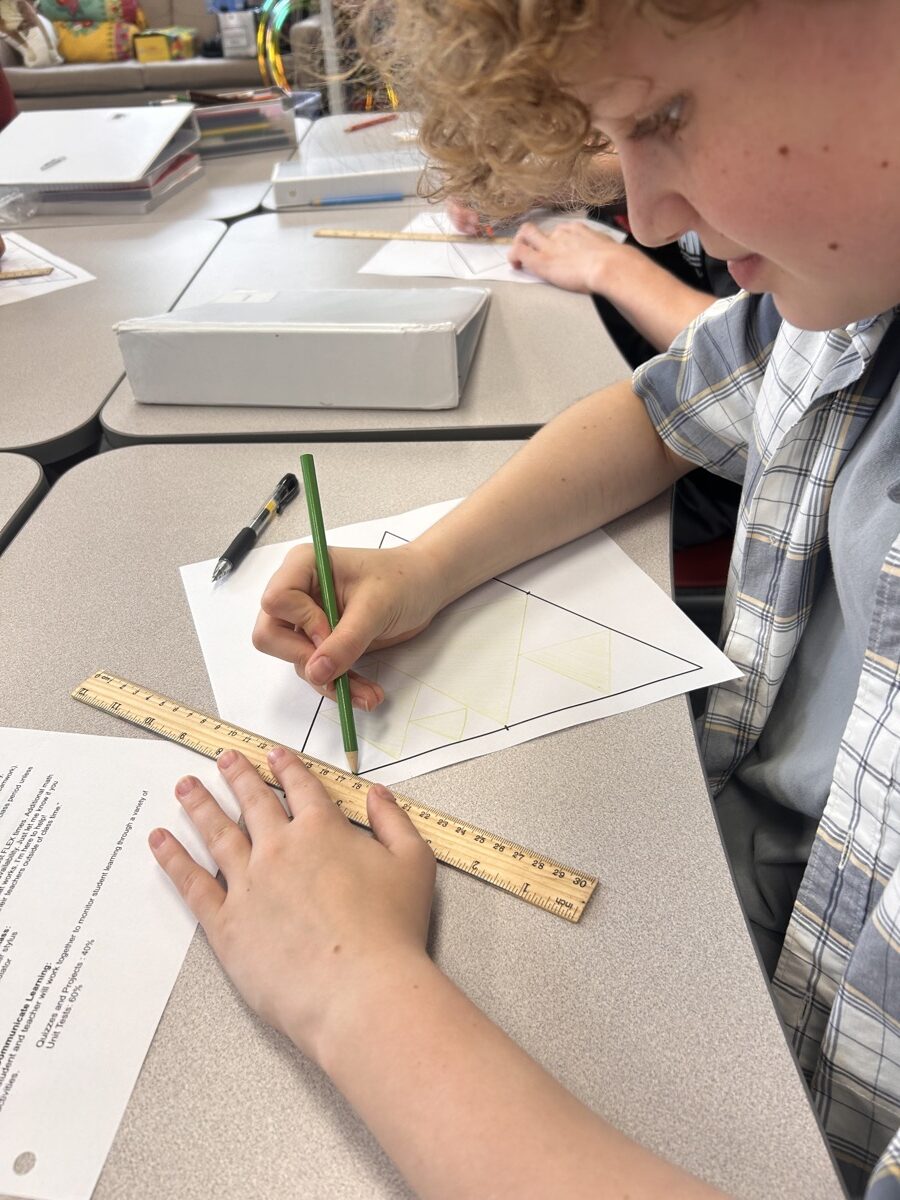
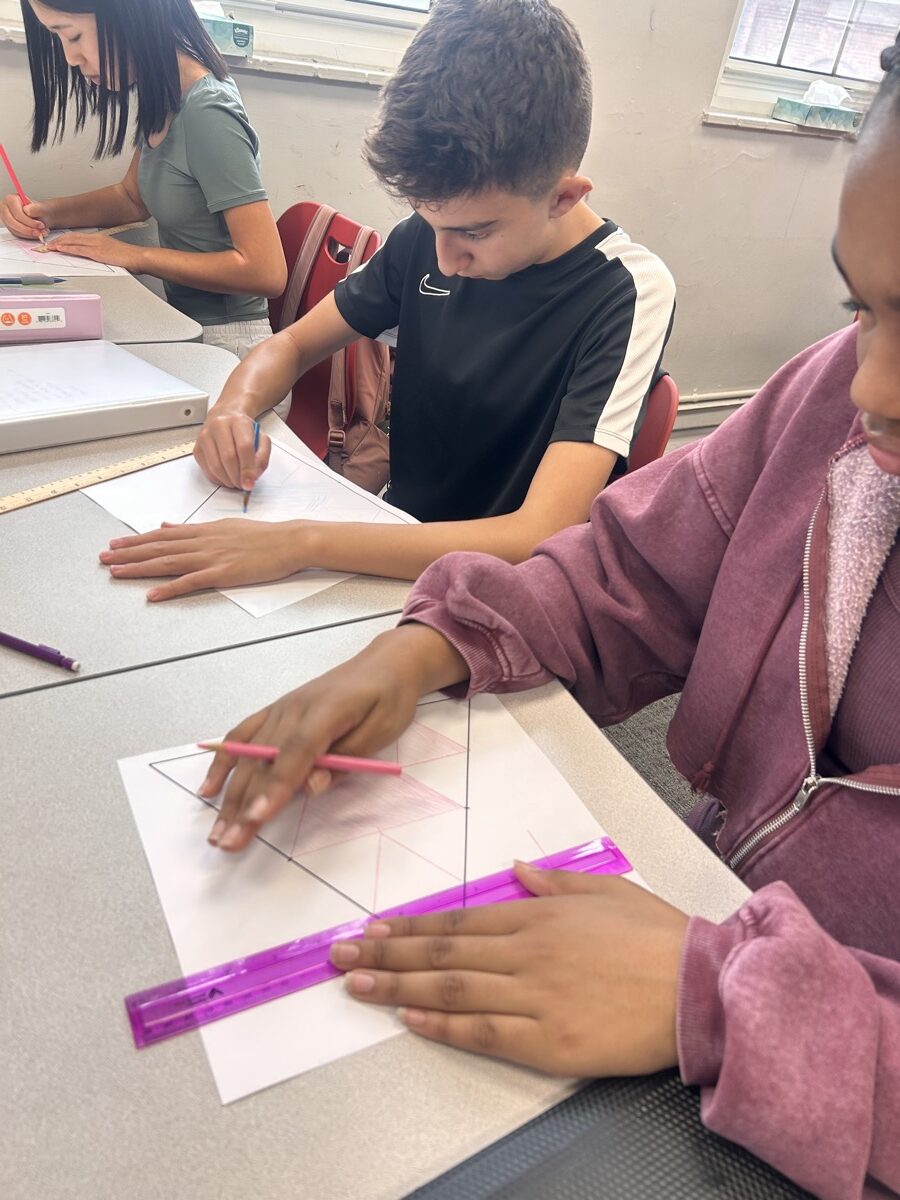
Students drew geometric fractals by starting with one large triangle, cutting smaller upside-down triangles from it, and repeatedly dividing the remaining pieces. Students counted the number of triangles created at each step, illustrating exponential growth.
The Quadratic Query
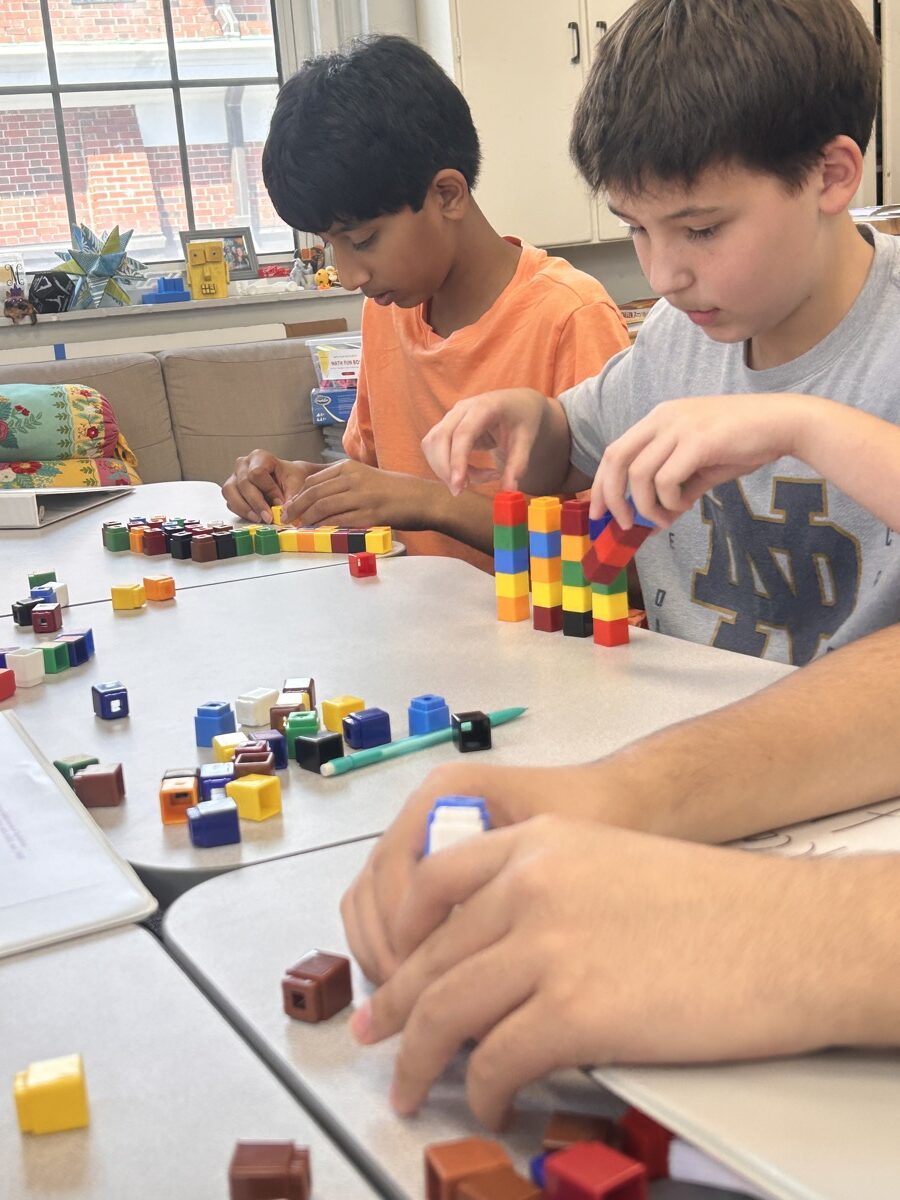
Working in teams of three with a builder, timer, and recorder, students used snapping cubes to build solid squares of increasing sizes. They measured the side length of the square and the total build time in seconds. Students then worked to build larger squares and noted the build time on a graph. Using the graph, students plotted a curved line that shows how expanding area affects the scale of a project.
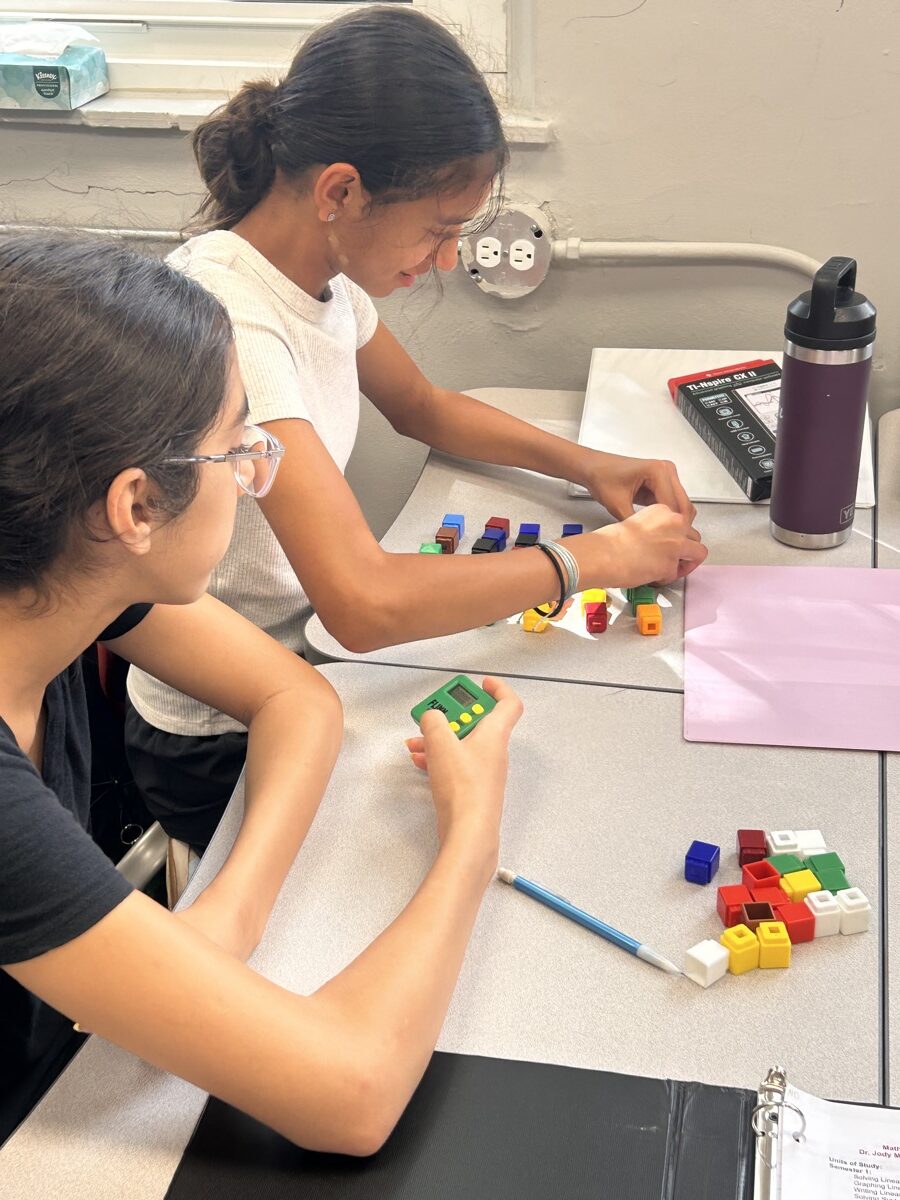
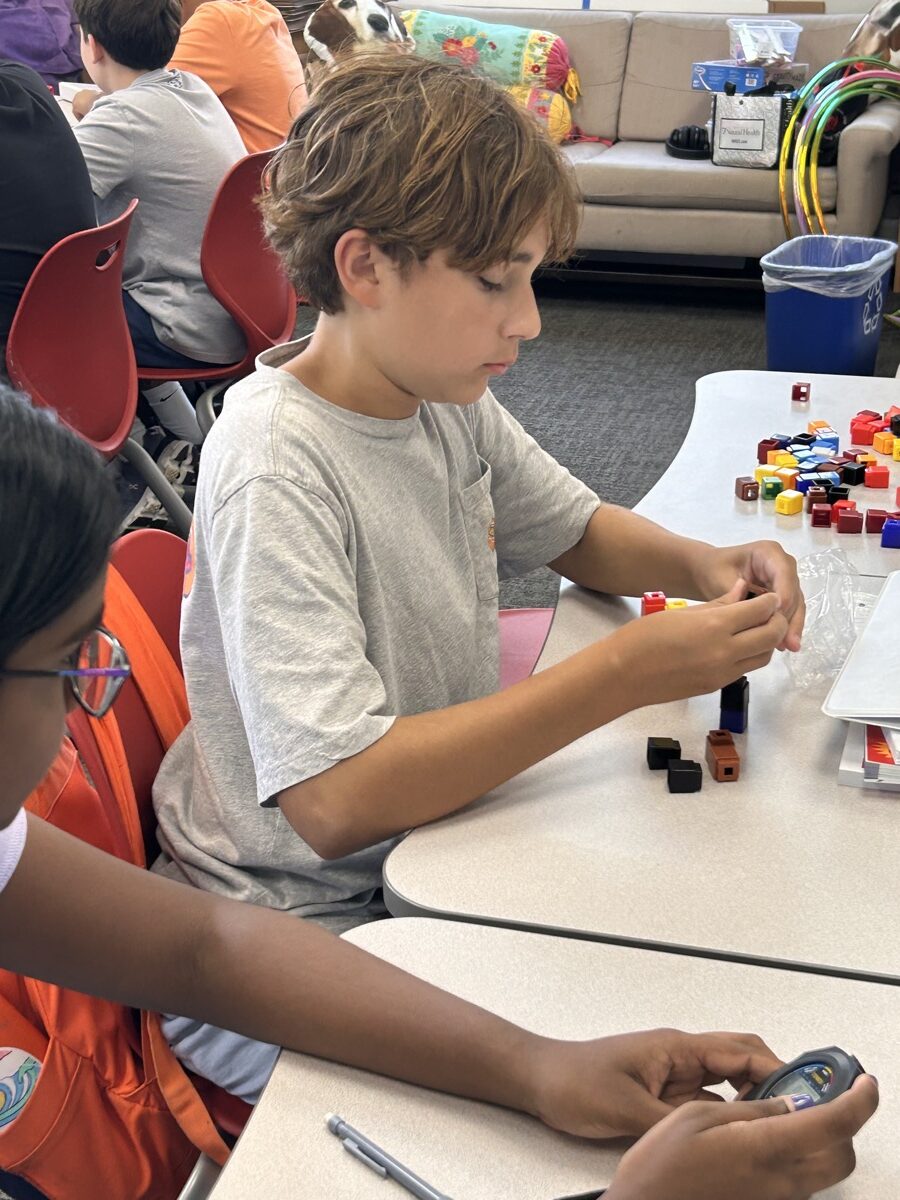
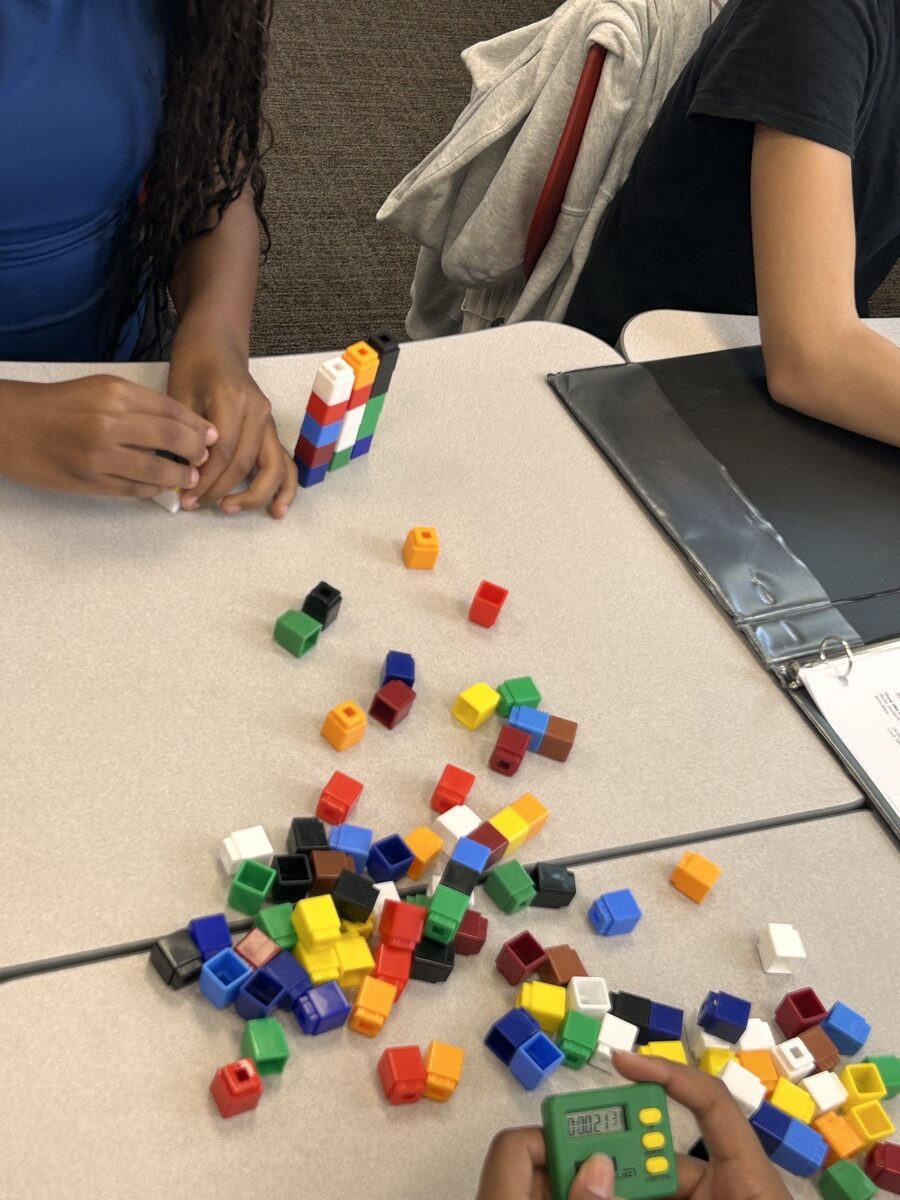
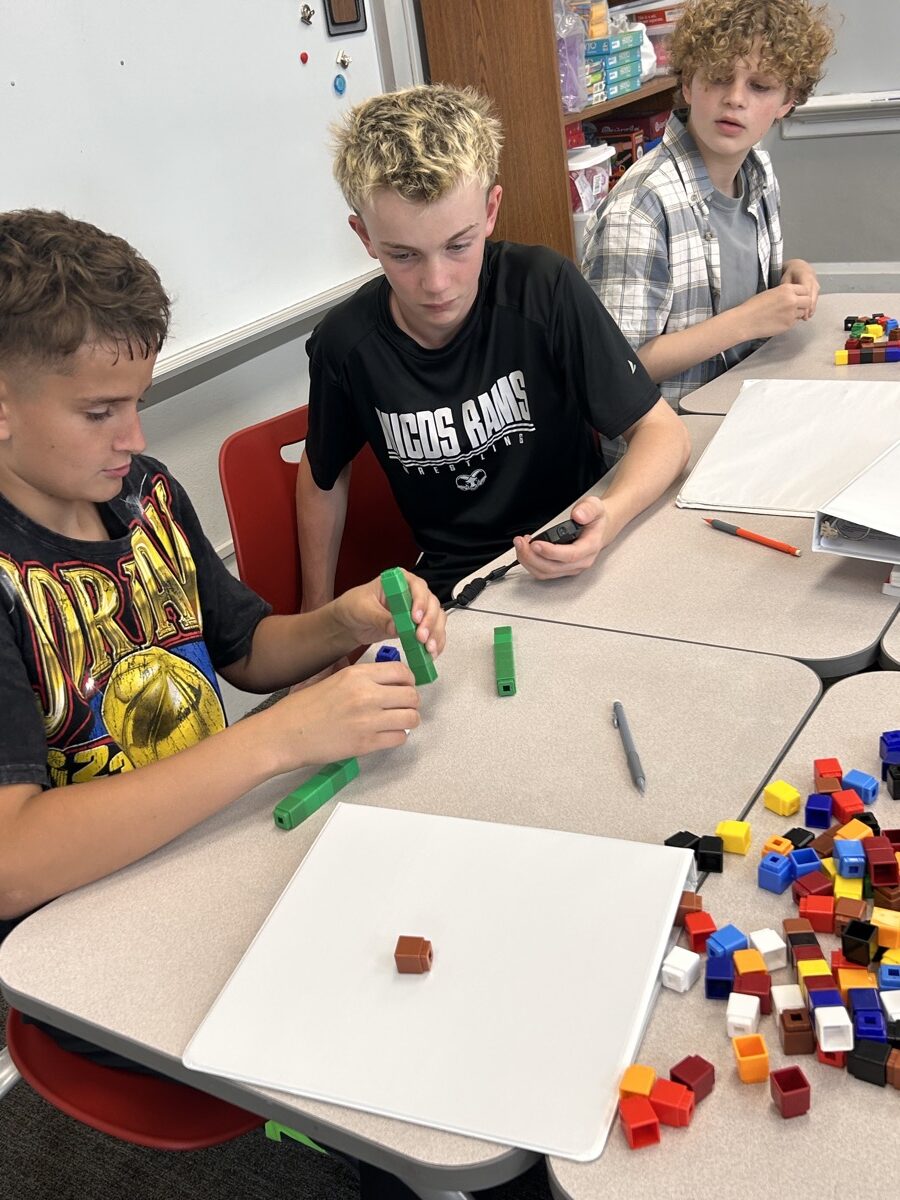
For Dr. Marberry, starting the year using physical activities to collect data is important to both classroom culture and curriculum. “Collecting data and using algebra to model real-world situations is such an important part of helping students develop conceptual understanding, and it’s a lot of fun, too,” she says
The hands-on approach was a winner with students. Mina A. ’31 says, “What I enjoyed the most about these different activities was that they were engaging and made us think instead of just sitting in a classroom on the first day listening to the teacher and classroom expectations. It helped improve my understanding of these math functions by giving a ‘smooth landing’ and showing us what we were going to be doing in general and that it isn’t going to be such a stressful year.”
Owen P. ’31 agreed. He says, “What I most enjoyed was how hands-on everything was. Instead of just looking at equations or being lectured for a straight 90 minutes, we got to see how math can correlate to the real world.”
Dr. Marberry added, “These activities at the beginning of the year help establish my expectations for how my classroom should run: there should be collaboration, problem solving, deep thinking, smiles, and plenty of laughter. And honestly, that’s part of why I teach. There’s nothing entirely altruistic about it. The kids make me laugh just as much as I hope I make them laugh.”