During the first week of the school year, 11th-grade History of St. Louis students were asked to give their own perspectives on the region. After vibrant discussions, it was time to cast the net wide and dig into questions like whether age, gender, zip code, or ethnicity influences how residents see the St. Louis region. These student historians jumped into a new, cross-curricular project determined to find out.
The History of St. Louis teachers—JK-12 History and Social Sciences Department Chair Carla Federman, Jason Asher, Max Campbell, Andy Cox, Alex Rolnick, and Elizabeth Wells—brainstormed this project last spring and, together, created a survey for the students to use. “The history department was incredibly fortunate to enlist the assistance of JK-12 Math Department Chair Diane Broberg and Upper School Math Teacher Travis Menghini to be our data analysis experts,” said Federman. “They were critical in helping design the assessment, test it, and look at it from a statistics point of view rather than just history and social science. Their collaboration added a new lens for history teachers as they embarked on this new idea.”
The History of St. Louis class for 11th-grade students centers around urban studies, which includes economics, population, transportation, environment, housing and built environment, education, health, security/policing/military, culture, and governance. The survey includes demographic and opinion questions, and each student was tasked with questioning two people, an immediate family member and someone outside of their family. One question asks respondents to compare St. Louis’ significance to other cities on a scale of 0-10; another asks them whether they think St. Louis is on the rise or on the decline. Other questions ask about perceptions of various urban studies topics.
“The goal is to get students thinking more broadly,” said Federman. “What are others’ perspectives and how might their demographics and backgrounds influence those perspectives?”
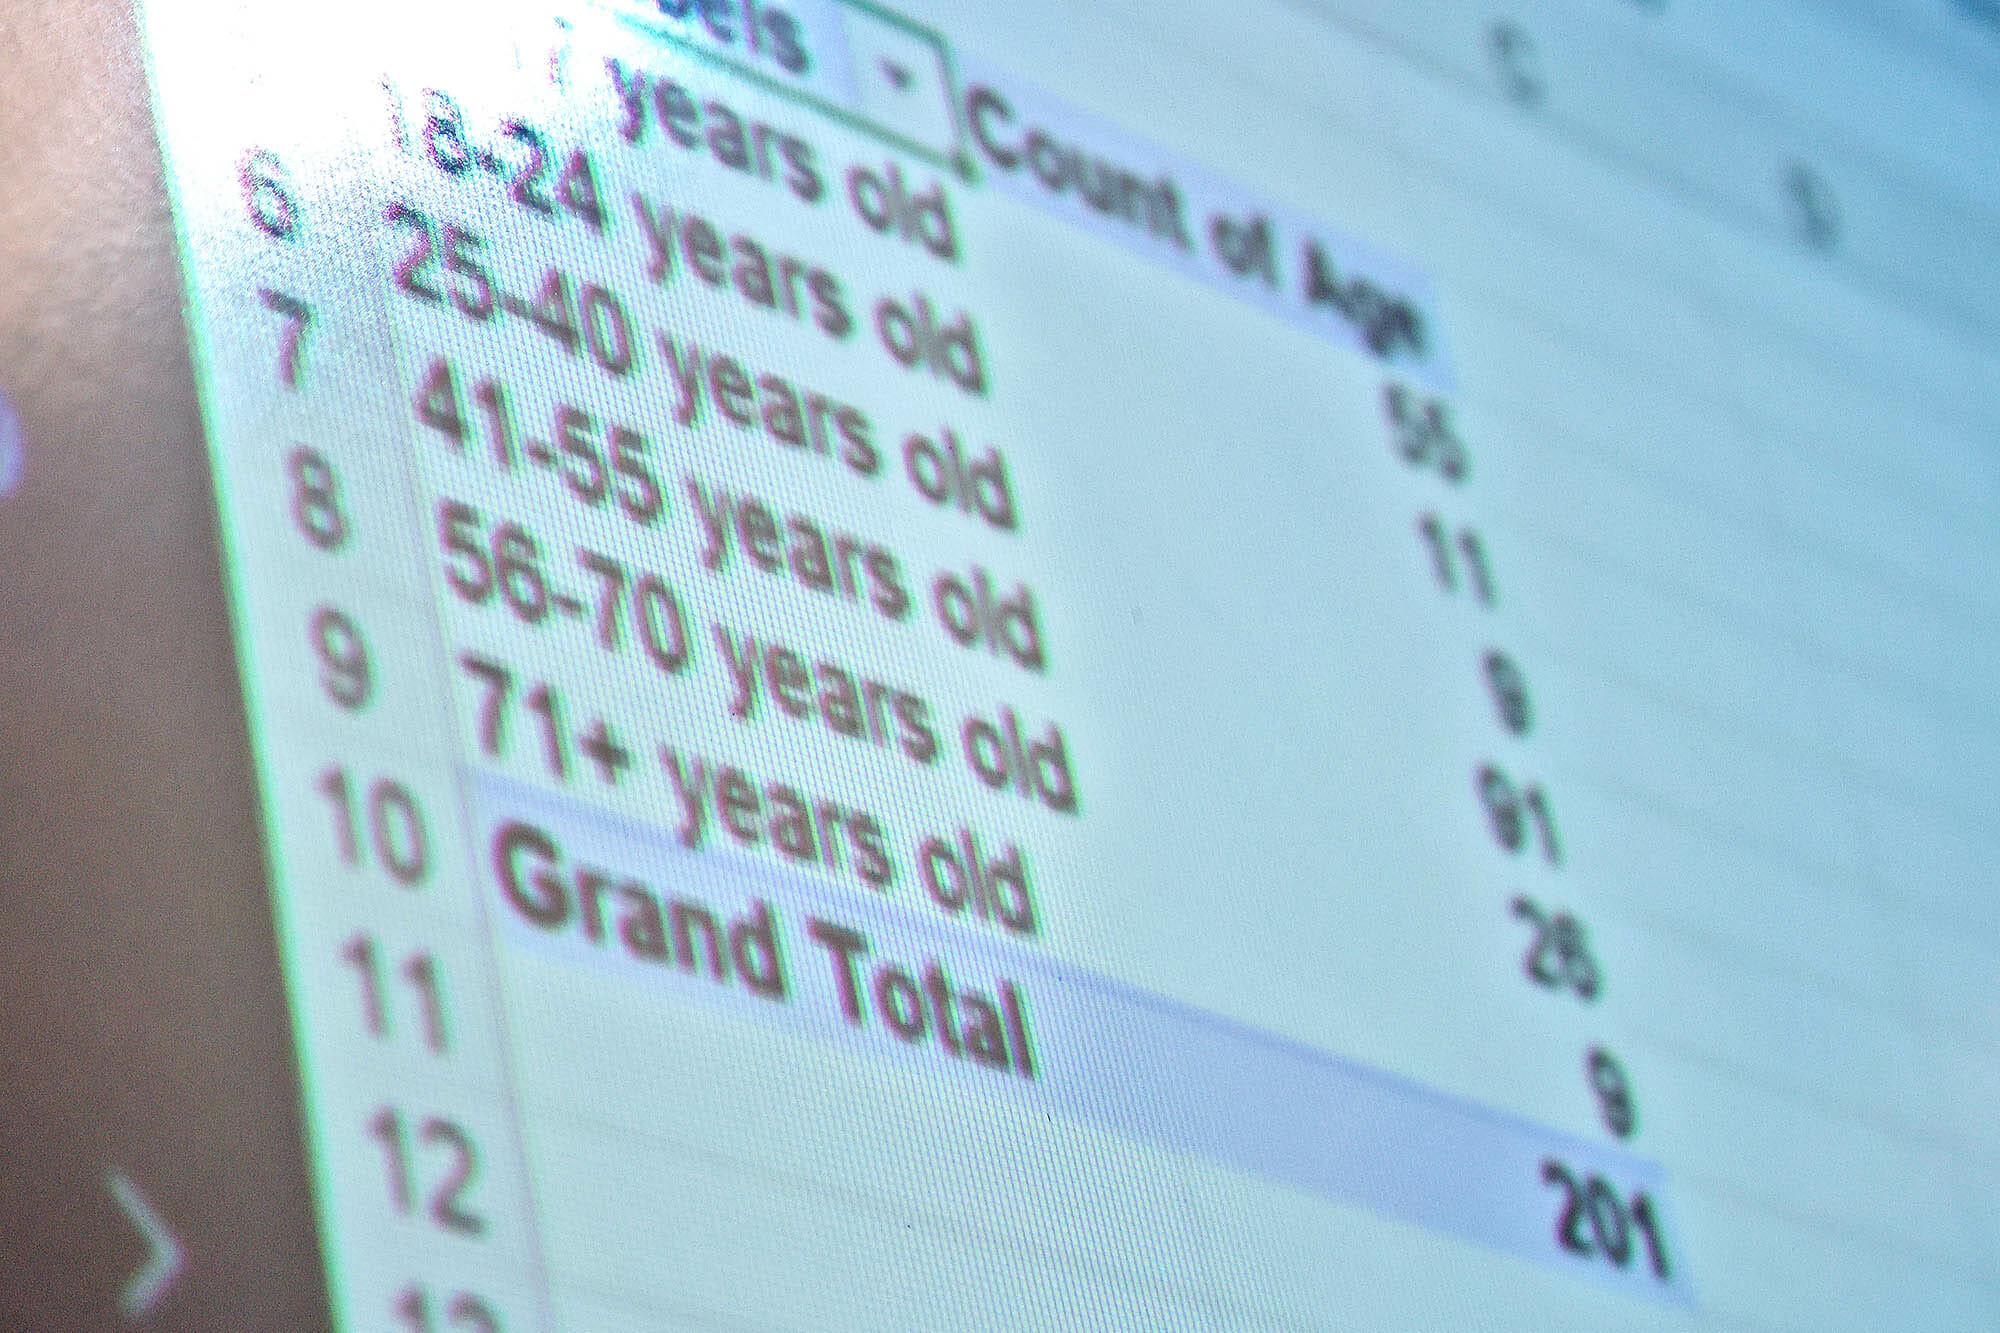
After a weekend of surveying friends and family and with loads of data in hand, the history students turned to the math teachers for help. Broberg and Menghini visited the History of St. Louis classrooms and led students through analyzing their data. They learned how to graph, how to make charts, and how to check whether age influences views about culture, for example.
Avery Summers ’24 thinks the project is a new and interesting way to learn how people view different factors of St. Louis. “I’m personally comparing the results of ethnicities’ views on education based on their highest degree of schooling,” she said. “I learned about the bias people carry and how it changes their views on the city and county.”
“It’s not a traditional history project,” said Federman, “and this gave them a chance to do interesting historical analysis while learning a skill that might be less obvious in a history classroom.” She was excited about the opportunity to bring math and history together, connect the content, and get students thinking critically about history and perspective while building a new skill set they will use beyond the classroom and beyond MICDS.


“I have learned plenty about how the various demographics of St. Louis perceive the metropolitan area’s different characteristics of society,” said Sam Ellenhorn ’24. “During this project we have searched for trends in statistical data that have helped us achieve a better understanding of the region that we live in. One of the relationships that stood out to me was the correlation between zip codes and the various perspectives of St. Louis, conveying that where one lives has a significant impact on how they view the many different aspects which make up the region.”
Ella Brauer ’24 was surprised to learn that some of the areas asked about seemed to compel a consistent response regardless of who answered the question. “I honestly thought it was surprising that demographics didn’t have that big of an impact on certain issues in St. Louis, like governance, security, or housing,” she said. “The general consensus was pretty heavy on the struggling side among all of the people interviewed, regardless of factors like ethnicity, gender, or zip code.”
“This project has allowed my grade to understand what people within the MICDS community think about the issues of St. Louis,” said Amir Muhammad ’24. “I’ve learned a lot more about both the positive and negative parts of St. Louis, more specifically the issues of housing in certain areas and improvements to downtown.”
“We’re asking students to make conclusions based on data the entire 11th grade class has gathered,” said Federman. “They use the qualitative and quantitative data together to build an argument about how people see St. Louis. Then we’re asking them to also identify possible flaws in this data set. What additional questions would I need to answer to assess the validity of this data?”
All of this work ties into teaching students how to think critically. “Just as we’re always teaching them to think critically and question their sources when it comes to texts, so too do we want them to apply those same skills here,” she continued. Historians think deeply about the sources they use, including the texts in front of them, and about the narratives and perspectives they see. A major component of this project is engaging students in the same critical thinking, teaching them to question the validity of their own data and dig into how much perspectives are influenced by other factors. Students are considering the strengths, limitations, and reliability of their sources, and are transferring those critical thinking skills to data analysis.
Broberg enjoyed working with the history students. She said, “In a world where we are bombarded with data, it’s important that students know how to draw conclusions based on data. The project allowed students to collect data that is relevant to their class and then compile and visualize it using Excel. This type of project also helps students see math at work outside the math classroom.”
“I’m really glad we did this project, and hope we come back to it in future years to make it better,” said Rolnick. “It is a unique way of introducing students to some basic skills in social science that also helped them to engage with a relevant dataset they collected, and widened their sense of the broader MICDS community’s views on the state of the St. Louis metropolitan area.”
Cross-disciplinary collaboration is a chance for students to use critical skills of thinking and analysis while incorporating multiple subjects. “What they are building in one section of the MICDS campus will absolutely come in handy in other sections,” Federman said. “We’re also teaching them how to study a city, so they can use what they learn about St. Louis and apply it more broadly to other places both in the United States and around the world.”
This sort of study, where students learn to combine their knowledge from two separate subjects to make better sense of the world, hopefully leads to a polymathic life full of curiosity and continued learning, and the ability to think critically about information presented from a variety of sources.